Monitor Kubernetes Cluster using New Relic

Stackademic is a learning hub for programmers, devs, coders, and engineers. Our goal is to democratize free coding education for the world.
New Relic
What is New Relic?
New Relic is a cloud-based software analytics and performance monitoring tool that helps developers, IT operations, and business leaders to understand the performance of their applications and infrastructure. It provides real-time insights into the workings of applications and infrastructure, enabling teams to observe, troubleshoot, and optimize their systems.
Here are some of the core features and functionalities of New Relic:
- Application Performance Monitoring (APM):
New Relic’s APM capabilities allow users to monitor the performance of their applications across different programming environments such as Java,.NET, Node.js, and more. It provides detailed information on response times, transaction volumes, error rates, and other critical performance metrics. - Infrastructure Monitoring:
This feature enables monitoring of physical, virtual, and cloud environments to manage the health and performance of servers and hosts. It gives visibility into the operation of the system resources like CPU, memory, disk usage, and network activity. - Real User Monitoring (RUM):
New Relic captures and analyzes front-end performance metrics to see how actual users are experiencing an application. This includes data on page load times and interactions within the application. - Synthetic Monitoring:
This involves using scripted browsers and API tests to simulate user interactions with applications to monitor performance and availability from different locations worldwide. - Dashboards and Alerting:
New Relic provides customizable dashboards to visualize data and set up alerting mechanisms that notify teams about system anomalies or when performance metrics exceed certain thresholds. - Data Analysis and Insights: New Relic Insights is a real-time analytics platform that allows users to query and visualize metric and event data collected from their applications.
In this article, we will explore how you can monitor your Kubernetes cluster using New Relic.
Prerequisites:
- Kubernetes cluster
- Helm installed
Step 1: Create New Relic Account
- Follow the link and create a new account.
- Enter your name, email, and click on Start Now.
Step 2: Add integration
- From the installation plan page, select Kubernetes.
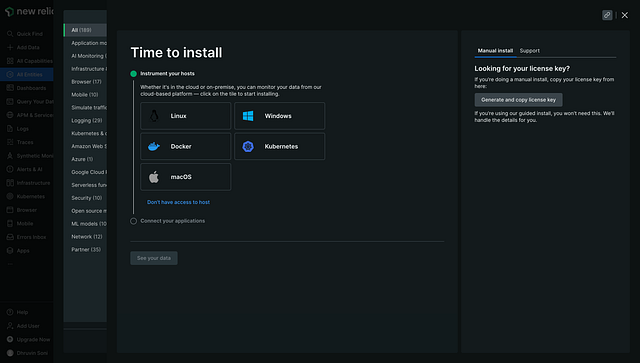
integration
Step 3: Provide the details of your cluster
- Provide your cluster name in the placeholder and click continue.
- You can change the namespace to install new relic agents in a different namespace by default it will create a namespace called newrelic and install it there.
- Choose Helm to install the new relic on your cluster.
- You will get the installation commands, and run those commands.
- Once the installation is completed, test the connection and you will see below.
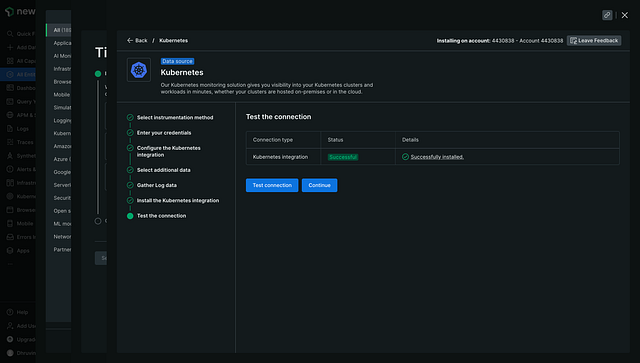
installation
Step 4: Verify the resources
- You can verify the installed resources by running the below command.
kubectl get all -n newrelic[dhruvinsoni@Dhruvins-MacBook-Pro Desktop (⎈|dhsoni@prod-cluster.ap-south-1.eksctl.io:N/A)]$ kubectl get all -n newrelic NAME READY STATUS RESTARTS AGE pod/newrelic-bundle-kube-state-metrics-8678b5769d-ds8cq 1/1 Running 0 36m pod/newrelic-bundle-newrelic-logging-qmqk5 1/1 Running 0 36m pod/newrelic-bundle-newrelic-prometheus-agent-0 1/1 Running 0 32m pod/newrelic-bundle-nri-kube-events-7784b49456-m6pjg 2/2 Running 0 36m pod/newrelic-bundle-nri-metadata-injection-56db7d58cc-ghfl7 1/1 Running 0 36m pod/newrelic-bundle-nrk8s-ksm-66594ffd8-g6t7k 2/2 Running 0 36m pod/newrelic-bundle-nrk8s-kubelet-xkwgv 2/2 Running 0 36m NAME TYPE CLUSTER-IP EXTERNAL-IP PORT(S) AGE service/newrelic-bundle-kube-state-metrics ClusterIP 10.100.103.48 <none> 8080/TCP 36m service/newrelic-bundle-nri-metadata-injection ClusterIP 10.100.19.115 <none> 443/TCP 36m NAME DESIRED CURRENT READY UP-TO-DATE AVAILABLE NODE SELECTOR AGE daemonset.apps/newrelic-bundle-newrelic-logging 1 1 1 1 1 <none> 36m daemonset.apps/newrelic-bundle-nrk8s-controlplane 0 0 0 0 0 kubernetes.io/os=linux 36m daemonset.apps/newrelic-bundle-nrk8s-kubelet 1 1 1 1 1 kubernetes.io/os=linux 36m NAME READY UP-TO-DATE AVAILABLE AGE deployment.apps/newrelic-bundle-kube-state-metrics 1/1 1 1 36m deployment.apps/newrelic-bundle-nri-kube-events 1/1 1 1 36m deployment.apps/newrelic-bundle-nri-metadata-injection 1/1 1 1 36m deployment.apps/newrelic-bundle-nrk8s-ksm 1/1 1 1 36m NAME DESIRED CURRENT READY AGE replicaset.apps/newrelic-bundle-kube-state-metrics-8678b5769d 1 1 1 36m replicaset.apps/newrelic-bundle-nri-kube-events-7784b49456 1 1 1 36m replicaset.apps/newrelic-bundle-nri-metadata-injection-56db7d58cc 1 1 1 36m replicaset.apps/newrelic-bundle-nrk8s-ksm-66594ffd8 1 1 1 36m NAME READY AGE statefulset.apps/newrelic-bundle-newrelic-prometheus-agent 1/1 36m [dhruvinsoni@Dhruvins-MacBook-Pro Desktop (⎈|dhsoni@prod-cluster.ap-south-1.eksctl.io:N/A)]$
Step 5: Monitor your cluster
- You can now monitor your cluster on the UI.

total pods
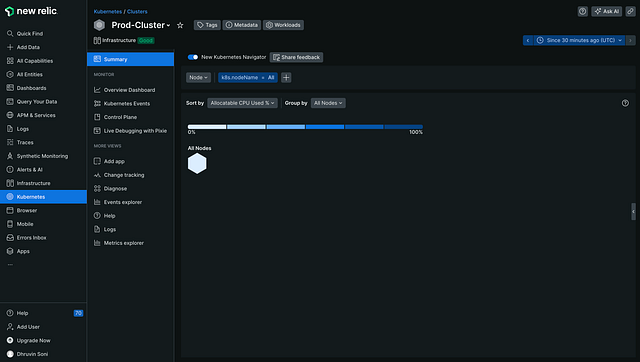
total nodes
- You can even change the time from the right corner.
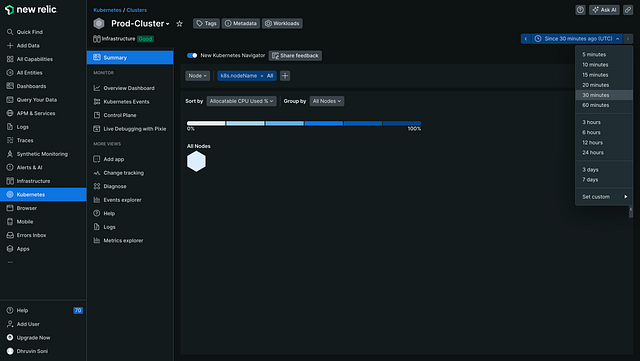
time
Step 6: Query the data
- NRQL is New Relic’s SQL-like query language.
- You can use NRQL to retrieve detailed New Relic data and get insight into your applications, hosts, and business-important activity.
- Run the below query to check all the running pods.
SELECT podName FROM K8sPodSample WHERE clusterName ='Prod-Cluster' and status ='Running'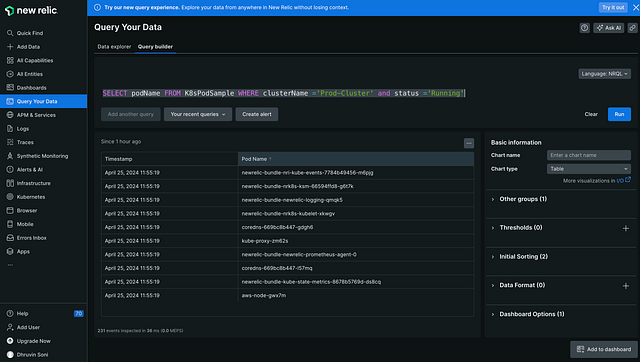
pods details
- Run the below command to get the IP of all the running pods.
SELECT podIP FROM K8sPodSample WHERE clusterName ='Prod-Cluster' and status ='Running'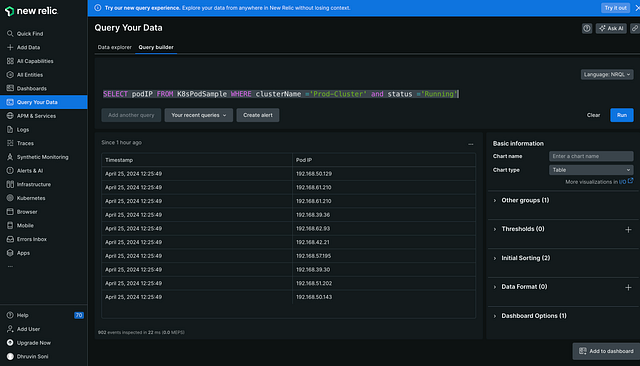
pods IP
Step 7: Create a new alert policy
- Click on alert policy and give it a name.
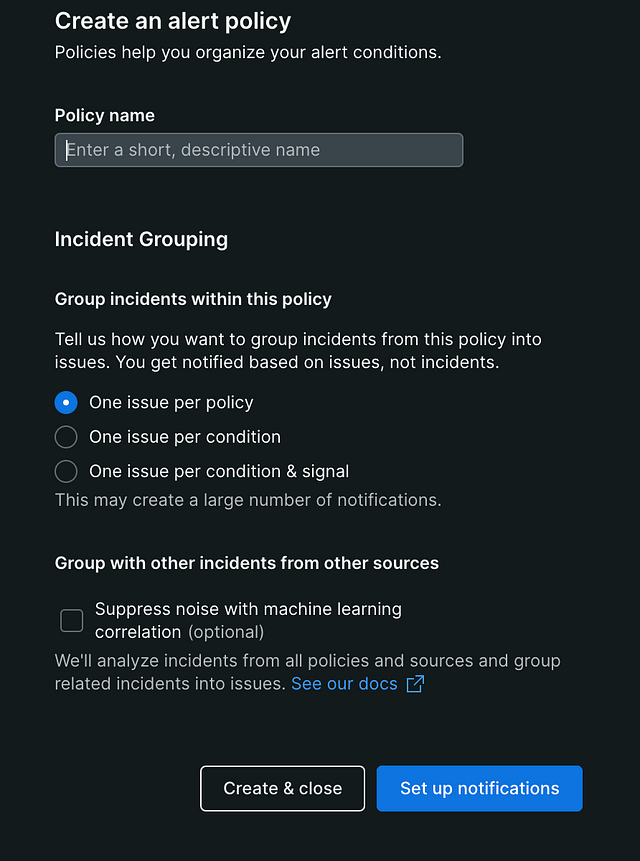
alert policy
- We will receive an alert on Email so, click on Email.
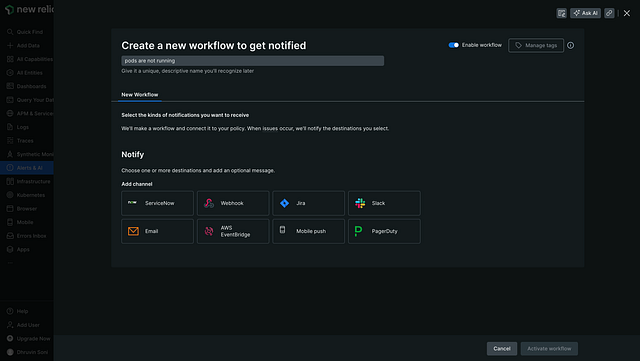
alert receive
- Click on the new destination and add your email.
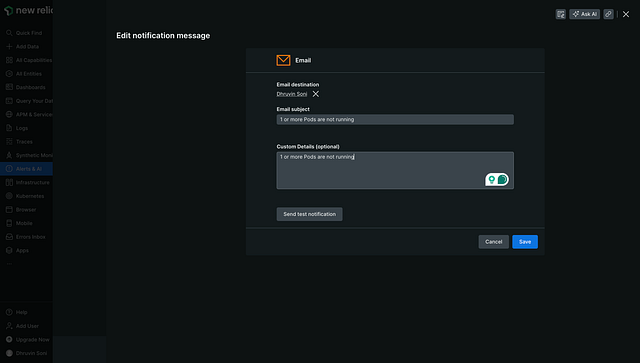
email subject
- Click on send test condition to test.

test condition
- Check the mail, you will receive the mail from new relic.
Step 8: Set the Alerts condition
- Click on the alert policy that you have created.

alert policy
- Now, click on the new alert condition, click on write your own query, and enter the below query.
SELECT count(*) FROM K8sPodSample WHERE clusterName ='Prod-Cluster' and status !='Running' - The above query will return the count of the pods which are not running.

count
- As of now, I have all the pods that are running to the count is 0.
- Now, set the alert condition.

alert condition
- I’ve set the alert to trigger when we have any pods that are not running for at least 1 minute.
- Give a name to alert the condition.
Step 9: Test the alert
- Now, I’ve edited the deployment and changed the image name, and as you can see the pod is not running.
[dhruvinsoni@Dhruvins-MacBook-Pro Desktop (⎈|dhsoni@prod-cluster.ap-south-1.eksctl.io:N/A)]$ kubectl edit deployment.apps/newrelic-bundle-kube-state-metrics -n newrelic deployment.apps/newrelic-bundle-kube-state-metrics edited [dhruvinsoni@Dhruvins-MacBook-Pro Desktop (⎈|dhsoni@prod-cluster.ap-south-1.eksctl.io:N/A)]$ kubectl get all -n newrelic NAME READY STATUS RESTARTS AGE pod/newrelic-bundle-kube-state-metrics-65cd774fc6-qzzzm 0/1 ErrImagePull 0 4s - After 1 minute passed, you will receive the mail like below.

Conclusion:
In conclusion, monitoring a Kubernetes cluster with New Relic offers a comprehensive solution for gaining insights into cluster performance, resource utilization, and potential bottlenecks. By leveraging New Relic’s powerful analytics and visualization capabilities, DevOps teams can not only detect issues in real-time but also predict future challenges, optimizing the cluster’s efficiency and reliability.
If you found this guide helpful then do click on 👏 the button and also feel free to drop a comment.
Follow for more stories like this 😊
Stackademic 🎓
Thank you for reading until the end. Before you go:
- Please consider clapping and following the writer! 👏
- Follow us X | LinkedIn | YouTube | Discord
- Visit our other platforms: In Plain English | CoFeed | Venture | Cubed
- More content at Stackademic.com


Stackademic is a learning hub for programmers, devs, coders, and engineers. Our goal is to democratize free coding education for the world.
Senior Cloud Infrastructure Engineer | AWS | Automation | 2x AWS | CKA | Terraform Certified | k8s | Docker | CI/CD | http://dhsoni.info/
More from Dhruvin Soni and Stackademic
Recommended from Medium
[
See more recommendations
](https://medium.com/?source=post_page---read_next_recirc--e9dfbade05d9---------------------------------------)