Grafana Loki-Stack and Agent in Minikube using Helm
Hello to all the tech enthusiasts out there. Its been a long time since I wrote a blog. And here I am back with setting up some observability components using Minikube, Grafana and helm. Don’t worry if you dont understand these components, as I will be explaining about each of them and its functionalities.

In today’s fast-paced world, efficient software development and deployment are crucial. Thankfully, application containerisation has emerged as a powerful tool for developers and businesses alike. But what exactly is it, and how does it work?
Containers
Think of a container as a self-contained box. Inside, you’ll find everything an application needs to run: its code, libraries, dependencies, and configuration files. But unlike a traditional box, these containers are lightweight and portable. They don’t require a full operating system, just a shared kernel on the host machine. This makes them much smaller and more efficient than virtual machines, the older technology they’re often compared to.
Docker and Containerd are the trending runtime tools that supports containerised applications.
Then what is Container Orchestration?
Imagine managing a large number of individual containers, each representing microservices or parts of your application, across multiple servers. Container orchestration is the automation of tasks to make this process as seamless and efficient as possible.
Kubernetes is one of the well known Container orchestration system in the recent times.
Minikube
Minikube is a local Kubernetes tool that helps developers and beginners easily set up a single-node Kubernetes cluster on their personal computers or laptops. It allows them to experiment with Kubernetes, learn its functionalities, and develop and test containerised applications in a local development environment.
Usage of Helm
Helm is a popular package manager specifically designed for Kubernetes applications. It simplifies the process of defining, installing, and managing your containerised applications on Kubernetes clusters.
In simple terms, helm packs all the Kubernetes manifests and makes them configurable using the values.yaml file based on different use cases.
Grafana, Loki, and Promtail (in grafana/loki-stack)
Grafana is a powerful open-source platform specifically designed for visualizing and analyzing various types of data related to your applications and infrastructure. It acts as a central hub where you can bring together information to gain insights into system health, performance, and behavior.
Here’s a breakdown of Grafana’s key features and functionalities:
Data Visualisation:
- Dashboard Creation: Grafana allows you to create customizable dashboards that display key performance indicators (KPIs), trends, and anomalies using various chart types like graphs, heatmaps, and tables. You can arrange these visualizations in a structured manner for efficient monitoring.
- Data Source Integration: It integrates with a wide range of data sources, including:
- Prometheus: For collecting and analyzing metrics about your application and infrastructure performance.
- Loki: For storing and querying logs generated by your systems.
- InfluxDB: For storing and visualizing time-series data.
- Graphite: Another popular platform for collecting and storing metrics.
- Many others: Grafana offers plugins for various data sources, allowing you to connect it to different monitoring tools and platforms.
Customisation and Interactivity:
- Tailored Dashboards: Grafana provides extensive customization options for dashboards. You can configure how data is displayed, set thresholds for alerts, and personalize the layout to suit your specific needs.
- Interactive Exploration: Dashboards can be interactive, allowing users to drill down into specific data points, zoom in on time ranges, or filter information based on different criteria
Loki:
Loki emerges as a powerful open-source tool designed specifically for log aggregation at scale.
Purpose: Loki’s primary focus is efficiently collecting, storing, and querying large volumes of logs generated by your applications, infrastructure components, and system services. It caters to scenarios where traditional log management solutions might struggle with the sheer amount of data produced in modern distributed systems.
Promtail:
Promtail, within the monitoring and observability landscape, acts as a lightweight log collector specifically designed to work with Loki. It plays a crucial role in efficiently gathering logs from various sources and forwarding them to the Loki server for storage and analysis.
Promtail will be installed on each machine (nodes in the case of containerised application) and scrape logs from them.
Grafana Agent
Grafana Agent is an open-source, batteries-included telemetry collector designed for efficiency and flexibility. It acts as a central hub for gathering crucial data vital for understanding your application’s behaviour and performance.
In this article, I will be using Grafana agent to pull Kubernetes events and emit these events to Loki as logs in JSON format. Having these events as logs in JSON format makes it easier to execute various filtering queries using LogQL and also to setup alerts based on various scenarios.
Prerequisites Setup
The local infrastructure setup
Once the minikube cluster is up and running make sure to enable the ingress addon using minikube addons enable ingress command.
Lets verify if the minikube setup is fine using the command kubectl get pods --all-namespaces and you should be able to see the following output.
NAMESPACE       NAME                                        READY   STATUS      RESTARTS      AGE
ingress-nginx   ingress-nginx-admission-create-hbx5z        0/1     Completed   0             110s
ingress-nginx   ingress-nginx-admission-patch-7k2fk         0/1     Completed   1             110s
ingress-nginx   ingress-nginx-controller-7c6974c4d8-jt2wm   1/1     Running     0             110s
kube-system     coredns-5dd5756b68-znthm                    1/1     Running     2 (17d ago)   18d
kube-system     etcd-minikube                               1/1     Running     2 (17d ago)   18d
kube-system     kube-apiserver-minikube                     1/1     Running     2 (17d ago)   18d
kube-system     kube-controller-manager-minikube            1/1     Running     2 (17d ago)   18d
kube-system     kube-proxy-f9xcz                            1/1     Running     2 (17d ago)   18d
kube-system     kube-scheduler-minikube                     1/1     Running     2 (17d ago)   18d
kube-system     storage-provisioner                         1/1     Running     5 (37m ago)   18d
Lets setup Grafana and Loki!
- To setup Grafana with loki, we will be using the
grafana/loki-stackhelm chart. In order to configure this chart run the below commands:- helm repo add grafana https://grafana.github.io/helm-charts - helm repo update - Once the above commands are executed, create a helm values file with the name
loki-stack-values.yamlwith the below content:loki: enabled: true size: 1Gi promtail: enabled: true grafana: enabled: true sidecar: datasources: enabled: true - After the value file is created use the below helm command to deploy the loki-stack chart with the above mentioned configuration values.
helm upgrade --install loki --namespace=loki-stack grafana/loki-stack --values loki-stack-values.yaml --create-namespace - Make sure to copy the complete command above and execute. Once done you should be able to see the following output for the command
kubectl get pods -n loki-stack:NAME READY STATUS RESTARTS AGE loki-0 1/1 Running 0 4m50s loki-grafana-7b459df484-x2rc4 2/2 Running 0 4m50s loki-promtail-ptl5m 1/1 Running 0 4m50s - Now lets also try to setup Grafana-Agent using the below helm value file. I named it as
grafana-agent-values.yamland its content are as below:agent: # -- Mode to run Grafana Agent in. Can be "flow" or "static". mode: 'flow' configMap: # -- Create a new ConfigMap for the config file. create: true # -- Content to assign to the new ConfigMap. This is passed into \`tpl\` allowing for templating from values. content: | logging { level = "info" format = "logfmt" } loki.source.kubernetes_events "events" { log_format = "json" forward_to = [loki.write.loki_endpoint.receiver] } loki.write "loki_endpoint" { endpoint { url = "http://loki.loki-stack:3100/loki/api/v1/push" } } - In order to deploy the Grafana-Agent helm chart, use the below command with the above given values file.
helm repo add grafana https://grafana.github.io/helm-charts helm repo update helm upgrade --install grafana-agent --namespace=loki grafana/grafana-agent --values grafana-agent-values.yaml - To access the Grafana dashboard, execute the below command to forward the Grafana UI service from the minikube network to the localhost and then open
localhost:3000in your browser.kubectl port-forward svc/loki-grafana 3000:80 -n loki-stack - You should be able to see the Grafana UI prompting for login. To login as admin, type
adminfor username and to get the admin password, execute the below command to extract the password from the secret created by the Grafana stack deployment.kubectl get secret loki-grafana -n loki-stack -o jsonpath="{.data.admin-password}" | base64 --decode ; echo - Once logged in, you gain access to the Grafana UI. You can then navigate to
Exploretab and execute some LogQL after choosingLokias the data source.
In order to view the events emitted by grafana-agent, use the below LogQL to fetch them all:{job="loki.source.kubernetes_events"}
You can see the following outputs:
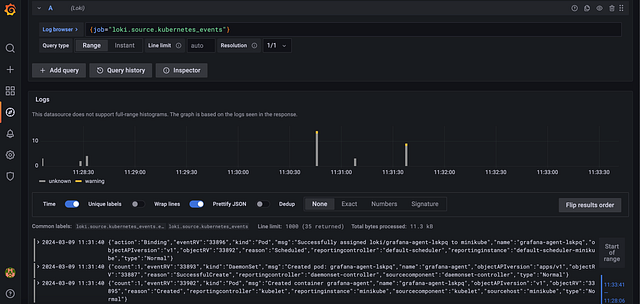
Kubernetes events as logs
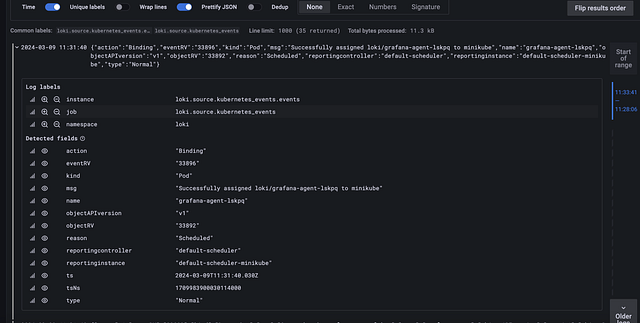
A single event log with JSON key and values
- In order to verify the logs of user applications, I have created a sample docker image that generates logs every 2 seconds. Create a
deployment.yamlfile with the below content.apiVersion: apps/v1 kind: Deployment metadata: name: test-log-generator spec: replicas: 1 selector: matchLabels: app: log-generator template: metadata: labels: app: log-generator spec: containers: - name: log-generator image: shai2426/log-generator:latest - Use the command below to deploy the same log application.
kubectl apply -f deployment.yaml - In order to view the logs of the deployed application, use the below LogQL:
{app="log-generator"} - The output should be something as below:
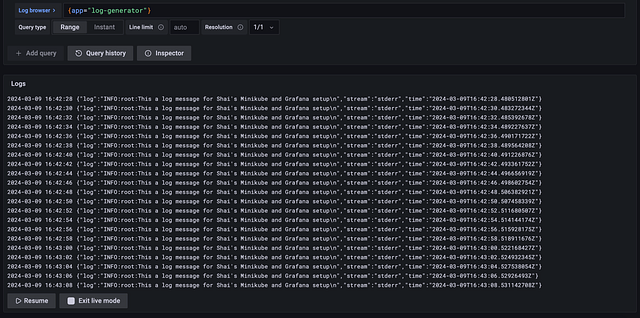
Hope setting up these observability components in Minikube was made easy by this blog. Lets catch up with some more interesting integration soon!
More from Shairam Sritharan
Recommended from Medium
[
See more recommendations
](https://medium.com/?source=post_page---read_next_recirc--a986e3dd2de6---------------------------------------)