Aller au contenu

Installer argocd-extension-metrics

Introduction

Ce tutoriel complet vous guide pas à pas pour installer Argo CD et intégrer les métriques Prometheus dans l’interface Argo CD en utilisant une approche GitOps.

VARIABLES

Entrez vos variables ici afin qu'elles soient appliquées à tous les fichiers de configuration de cet article.

Prérequis

Voici la liste des prérequis et leurs versions au moment de la rédaction:

  • Docker: 28.1.1
  • kubectl: v1.34.3
  • helm: v4.0.1
  • kind: kind v0.30.0 go1.25.4 linux/amd64
  • Connaissances de base des concepts Kubernetes
Installation des prérequis
brew install kubectl kind helm
kind
[ $(uname -m) = x86_64 ] && curl -Lo ./kind https://kind.sigs.k8s.io/dl/v0.30.0/kind-linux-amd64
chmod +x ./kind
sudo mv ./kind /usr/local/bin/kind
kubectl
curl -LO "https://dl.k8s.io/release/$(curl -L -s https://dl.k8s.io/release/stable.txt)/bin/linux/amd64/kubectl"
sudo install -o root -g root -m 0755 kubectl /usr/local/bin/kubectl
helm
curl -fsSL -o get_helm.sh https://raw.githubusercontent.com/helm/helm/main/scripts/get-helm-4
chmod 700 get_helm.sh
./get_helm.sh

Objectif

  • Installer Argo CD via Helm
  • Déployer Prometheus et visualiser les métriques dans Argo CD
  • Gérer toutes les applications via Argo CD Applications

Vue d’ensemble

Le tutoriel couvre: La création d’un cluster local Kind, l'installation d’Argo CD via helm, le déploiement d’applications via Argo CD, et intégration des métriques Prometheus dans l'UI d'Argo CD.

Nous allons réaliser ces étapes en utilisant une approche GitOps:

  1. Créer un cluster Kind (cluster Kubernetes local)
  2. Installer Argo CD (bootstrap – seule étape manuelle)
  3. Déployer tout le reste via Argo CD:
    • Prometheus (via un wrapper Helm)
    • Argocd-extension-metrics
    • Podinfo

Créer votre dépôt Git

Dans cette section, nous allons configurer la structure de votre dépôt Git pour Argo CD.
Ce dépôt contiendra tous les fichiers nécessaires pour déployer et gérer vos applications à l'aide de la méthode GitOps.
Vous organiserez vos applications, les valeurs Helm et les manifests Kubernetes dans une structure de répertoires claire et modulaire.

Structure du dépôt
argocd-gitops/
├── README.md
├── bootstrap/
│   └── argocd-values.yaml              # Valeurs initiales d'Argo CD pour Helm
├── apps/
│   ├── app-of-apps.yaml                # Root application (gère toutes les autres)   ├── prometheus.yaml                 # Application Prometheus   ├── metrics-server.yaml             # Application Metrics Server   └── podinfo.yaml                    # Application Podinfo
└── manifests/
    └── metrics-server/
        ├── kustomization.yaml
        ├── configmap.yaml
        └── deployment.yaml
Créer le répertoire du dépôt
mkdir argocd-gitops
cd argocd-gitops
Initialiser Git
git init
Créer la structure de répertoires
mkdir -p bootstrap apps manifests/metrics-server
Initialiser le dépôt Git
git add .
git commit -m "Initial structure"
Push vers votre hébergement Git (GitHub, GitLab, etc.)
git remote add origin https://github.com/YOUR-USERNAME/argocd-gitops.git
git push -u origin main

Tip

Vous pouvez créer votre propre dépôt en suivant ce guide, ou bien télécharger directement le dépôt prêt à l'emploi. https://github.com/Mathod95/016

Créer un cluster Kind

Nous allons créer un cluster Kubernetes local en utilisant Kind (Kubernetes dans Docker). Cela convient parfaitement pour les tests et le développement.

kind create cluster
OUTPUT
Creating cluster "kind" ...
  Ensuring node image (kindest/node:v1.34.0) 🖼
  Preparing nodes 📦
  Writing configuration 📜
  Starting control-plane 🕹
  Installing CNI 🔌
  Installing StorageClass 💾
Set kubectl context to "kind-kind"
You can now use your cluster with:

kubectl cluster-info --context kind-kind

Have a question, bug, or feature request? Let us know! https://kind.sigs.k8s.io/#community 🙂
CHECK
Check the cluster is running
kind get clusters
kind
Check nodes
kubectl get nodes
NAME                 STATUS   ROLES           AGE     VERSION
kind-control-plane   Ready    control-plane   8m38s   v1.34.0
Check context
kubectl config current-context
kind-kind

Déploiement d'Argo CD

C’est la seule étape d’installation manuelle. Une fois qu’Argo CD est opérationnel, nous l’utiliserons pour déployer tout le reste.

Ajouter le dépôt Helm d’Argo CD

helm repo add argo https://argoproj.github.io/argo-helm
helm repo update
OUTPUT
helm repo add argo https://argoproj.github.io/argo-helm
"argo" has been added to your repositories
helm repo update
Hang tight while we grab the latest from your chart repositories...
...Successfully got an update from the "argo" chart repository
Update Complete. ⎈Happy Helming!⎈

Créer le fichier de configuration d’Argo CD

Créer un fichier nommé bootstrap/argocd-values.yaml Ce fichier contient la configuration initiale d’Argo CD avec l’extension de métriques.

bootstrap/argocd-values.yaml
 1
 2
 3
 4
 5
 6
 7
 8
 9
10
11
12
13
14
15
16
17
18
19
20
21
22
23
24
25
26
27
28
29
30
31
32
33
34
# Argo CD Server configuration
server:
  # Enable and configure extensions
  extensions:
    enabled: true
    extensionList:
      - name: extension-metrics
        env:
          - name: EXTENSION_URL
            value: https://github.com/argoproj-labs/argocd-extension-metrics/releases/download/v1.0.3/extension.tar.gz
          - name: EXTENSION_CHECKSUM_URL
            value: https://github.com/argoproj-labs/argocd-extension-metrics/releases/download/v1.0.3/extension_checksums.txt

# Argo CD configuration
configs:
  # ConfigMap for extension configuration
  cm:
    extension.config: |
      extensions:
        - name: metrics
          backend:
            services:
              - url: http://argocd-metrics-server.argocd.svc:9003

  # Server parameters
  params:
    # Enable the proxy extension feature (required for metrics)
    server.enable.proxy.extension: "true"

  # RBAC configuration
  rbac:
    policy.csv: |
      p, role:readonly, extensions, invoke, metrics, allow
      p, role:admin, extensions, invoke, metrics, allow

Installation d'Argo CD

helm install argocd argo/argo-cd \
  --namespace argocd \
  --create-namespace \
  --values bootstrap/argocd-values.yaml \
  --wait
OUTPUT
NAME: argocd
LAST DEPLOYED: Thu Dec 11 09:10:58 2025
NAMESPACE: argocd
STATUS: deployed
REVISION: 1
DESCRIPTION: Install complete
TEST SUITE: None
NOTES:
In order to access the server UI you have the following options:

1. kubectl port-forward service/argocd-server -n argocd 8080:443

    and then open the browser on http://localhost:8080 and accept the certificate

2. enable ingress in the values file `server.ingress.enabled` and either
      - Add the annotation for ssl passthrough: https://argo-cd.readthedocs.io/en/stable/operator-manual/ingress/#option-1-ssl-passthrough
      - Set the `configs.params."server.insecure"` in the values file and terminate SSL at your ingress: https://argo-cd.readthedocs.io/en/stable/operator-manual/ingress/#option-2-multiple-ingress-objects-and-hosts


After reaching the UI the first time you can login with username: admin and the random password generated during the installation. You can find the password by running:

kubectl -n argocd get secret argocd-initial-admin-secret -o jsonpath="{.data.password}" | base64 -d

(You should delete the initial secret afterwards as suggested by the Getting Started Guide: https://argo-cd.readthedocs.io/en/stable/getting_started/#4-login-using-the-cli)
CHECK
Vérifiez si l'extension proxy est activée
kubectl get configmap argocd-cmd-params-cm -n argocd -o yaml | grep proxy
server.enable.proxy.extension: "true"
Vérifier les pods d’Argo CD
kubectl get pods -n argocd
NAME                                                READY   STATUS    RESTARTS   AGE
argocd-application-controller-0                     1/1     Running   0          22m
argocd-applicationset-controller-79f494df96-87l4z   1/1     Running   0          22m
argocd-dex-server-c5685b4c4-ch7xv                   1/1     Running   0          22m
argocd-notifications-controller-7cc7769574-7cmnw    1/1     Running   0          22m
argocd-redis-767d85d48f-nwsvz                       1/1     Running   0          22m
argocd-repo-server-568747db-nfvwp                   1/1     Running   0          22m
argocd-server-64788f557d-zshgz                      1/1     Running   0          22m

Obtenir le mot de passe administrateur

kubectl -n argocd get secret argocd-initial-admin-secret -o jsonpath="{.data.password}" | base64 -d && echo
2KId8ZZbYuBMTK6u

Accéder à l’interface utilisateur d’Argo CD

kubectl port-forward svc/argocd-server -n argocd 8080:443

Note

Ouvrez https://localhost:8080 et connectez-vous avec l’utilisateur admin et le mot de passe obtenu précédemment.

Vous verrez un avertissement de certificat. C’est normal pour les certificats auto-signés. Cliquez sur Avancé puis Continuer.

App of Apps

Créer le manifeste Application pour App-of-Apps

This is the root application that manages all other applications.

apps/app-of-apps.yaml
 1
 2
 3
 4
 5
 6
 7
 8
 9
10
11
12
13
14
15
16
17
18
19
20
apiVersion: argoproj.io/v1alpha1
kind: Application
metadata:
  name: root-app
  namespace: argocd
  finalizers:
    - resources-finalizer.argocd.argoproj.io
spec:
  project: default
  source:
    repoURL: https://github.com/YOUR-USERNAME/argocd-gitops.git
    targetRevision: HEAD
    path: apps
  destination:
    server: https://kubernetes.default.svc
    namespace: argocd
  syncPolicy:
    automated:
      prune: true
      selfHeal: true

Important: Replace YOUR-USERNAME with your actual GitHub username!

Prometheus

Nous allons maintenant déployer Prometheus en utilisant un wrapper Helm.

Créer le manifeste de Application Prometheus

Create a file named prometheus-app.yaml:

prometheus-app.yaml
 1
 2
 3
 4
 5
 6
 7
 8
 9
10
11
12
13
14
15
16
17
18
19
20
21
22
23
24
25
26
27
28
29
30
31
32
33
34
35
36
37
38
39
40
41
42
43
44
45
46
47
48
49
50
51
52
53
54
55
56
57
58
59
60
61
62
apiVersion: argoproj.io/v1alpha1
kind: Application
metadata:
  name: kube-prometheus-stack
  namespace: argocd
  finalizers:
    - resources-finalizer.argocd.argoproj.io
spec:
  project: default
  source:
    # Using Helm chart directly from the repository
    repoURL: https://prometheus-community.github.io/helm-charts
    chart: kube-prometheus-stack
    targetRevision: 65.1.1  # Pin to a specific version for reproducibility
    helm:
      # Helm values can be customized here
      values: |
        # Disable components we don't need for this demo
        alertmanager:
          enabled: false

        # Reduce resource usage for local development
        prometheus:
          prometheusSpec:
            resources:
              requests:
                cpu: 200m
                memory: 512Mi
              limits:
                cpu: 500m
                memory: 1Gi
            retention: 6h
            storageSpec:
              volumeClaimTemplate:
                spec:
                  accessModes: ["ReadWriteOnce"]
                  resources:
                    requests:
                      storage: 5Gi

        grafana:
          enabled: true
          adminPassword: admin
          resources:
            requests:
              cpu: 100m
              memory: 128Mi
            limits:
              cpu: 200m
              memory: 256Mi

  destination:
    server: https://kubernetes.default.svc
    namespace: monitoring

  syncPolicy:
    automated:
      prune: true
      selfHeal: true
    syncOptions:
      - CreateNamespace=true
      - ServerSideApply=true
CHECK

Vous pouvez suivre le déploiement de Prometheus de deux manières:

Observer la synchronisation de l'application
kubectl get application kube-prometheus-stack -n argocd -w
NAME                    SYNC STATUS   HEALTH STATUS
kube-prometheus-stack   Synced        Healthy

Observer la création des pods dans le namespace monitoring
kubectl get pods -n monitoring -w
NAME                                                        READY   STATUS    RESTARTS   AGE
kube-prometheus-stack-grafana-5b546b8c56-nqg2q              3/3     Running   0          113s
kube-prometheus-stack-kube-state-metrics-74988dd77d-x7n74   1/1     Running   0          113s
kube-prometheus-stack-operator-84df4fd8d-45wqd              1/1     Running   0          113s
kube-prometheus-stack-prometheus-node-exporter-gsttg        1/1     Running   0          113s
prometheus-kube-prometheus-stack-prometheus-0               2/2     Running   0          107s
Appuyez sur Ctrl+C pour arrêter l'observation une fois que tous les pods sont en cours d'exécution.

  1. Actualisez l'interface utilisateur d'Argo CD https://localhost:8080
  2. Vous verrez l'application kube-prometheus-stack
  3. Cliquez dessus pour voir la progression du déploiement
  4. Attendez que l'état soit "Healthy" et "Synced"

NOTE

Accéder à l'interface de Prometheus

kubectl port-forward -n monitoring svc/prometheus-kube-prometheus-prometheus 9090:9090

Ouvrez http://localhost:9090 et essayez des requêtes comme :

container_cpu_usage_seconds_total{namespace="podinfo"}
container_memory_usage_bytes{namespace="podinfo"}

Accéder à l'interface de Grafana

kubectl port-forward -n monitoring svc/kube-prometheus-stack-grafana 3000:80

Ouvrez http://localhost:3000

  • User: admin
  • Pass: admin (comme configuré dans l'application Prometheus)

Explorez les tableaux de bord Kubernetes pré-configurés !

Argo CD Extension Metrics

Créer le manifeste Application argocd-extension-metrics

apps/metrics-server.yaml
 1
 2
 3
 4
 5
 6
 7
 8
 9
10
11
12
13
14
15
16
17
18
19
20
apiVersion: argoproj.io/v1alpha1
kind: Application
metadata:
  name: argocd-metrics-server
  namespace: argocd
  finalizers:
    - resources-finalizer.argocd.argoproj.io
spec:
  project: default
  source:
    repoURL: https://gitea.mathod.fr/mathod/argocd-gitops.git
    targetRevision: HEAD
    path: manifests/metrics-server
  destination:
    server: https://kubernetes.default.svc
    namespace: argocd
  syncPolicy:
    automated:
      prune: true
      selfHeal: true

Créer le manifeste Service argocd-extension-metrics

manifests/metrics-server/service.yaml
 1
 2
 3
 4
 5
 6
 7
 8
 9
10
11
12
13
14
15
apiVersion: v1
kind: Service
metadata:
  name: argocd-metrics-server
  labels:
    app.kubernetes.io/name: argocd-metrics-server
    app.kubernetes.io/part-of: argocd
spec:
  ports:
  - name: metrics
    port: 9003
    protocol: TCP
    targetPort: 9003
  selector:
    app: argocd-metrics-server

Créer le manifeste Kustomization argocd-extension-metrics

manifests/metrics-server/kustomization.yaml
1
2
3
4
5
6
apiVersion: kustomize.config.k8s.io/v1beta1
kind: Kustomization
resources:
- configmap.yaml
- deployment.yaml
- service.yaml

Créer le manifeste Deployment argocd-extension-metrics

manifests/metrics-server/deployment.yaml
 1
 2
 3
 4
 5
 6
 7
 8
 9
10
11
12
13
14
15
16
17
18
19
20
21
22
23
24
25
26
27
28
29
30
31
32
33
34
35
36
37
apiVersion: apps/v1
kind: Deployment
metadata:
  name: argocd-metrics-server
spec:
  selector:
    matchLabels:
      app: argocd-metrics-server
  strategy:
    type: Recreate
  template:
    metadata:
      labels:
        app: argocd-metrics-server
    spec:
      containers:
        - image: quay.io/argoprojlabs/argocd-extension-metrics:latest
          imagePullPolicy: IfNotPresent
          args:
            - '-enableTLS=false'
          name: argocd-metrics-server
          ports:
            - containerPort: 9003
              name: metrics
              protocol: TCP
          resources:
            requests:
              cpu: 100m
              memory: 100Mi
          volumeMounts:
            - name: config-volume
              mountPath: /app/config.json
              subPath: config.json
      volumes:
        - name: config-volume
          configMap:
            name: argocd-metrics-server-configmap

Créer le manifeste ConfigMap argocd-extension-metrics

manifests/metrics-server/configmap.yaml
  1
  2
  3
  4
  5
  6
  7
  8
  9
 10
 11
 12
 13
 14
 15
 16
 17
 18
 19
 20
 21
 22
 23
 24
 25
 26
 27
 28
 29
 30
 31
 32
 33
 34
 35
 36
 37
 38
 39
 40
 41
 42
 43
 44
 45
 46
 47
 48
 49
 50
 51
 52
 53
 54
 55
 56
 57
 58
 59
 60
 61
 62
 63
 64
 65
 66
 67
 68
 69
 70
 71
 72
 73
 74
 75
 76
 77
 78
 79
 80
 81
 82
 83
 84
 85
 86
 87
 88
 89
 90
 91
 92
 93
 94
 95
 96
 97
 98
 99
100
101
102
103
104
105
106
107
108
109
110
111
112
113
114
115
116
117
118
119
120
121
122
123
124
125
126
127
128
129
130
131
132
133
134
135
136
137
138
139
140
141
142
143
144
145
146
147
148
149
150
151
152
153
154
155
156
157
158
159
160
161
162
163
164
165
166
167
168
169
170
171
172
173
174
175
176
177
178
179
180
181
182
183
184
185
186
187
188
189
190
191
192
193
194
195
196
197
198
199
200
201
202
203
204
205
206
207
208
209
210
211
212
213
214
215
216
217
218
219
220
221
222
223
224
225
226
227
228
229
230
231
232
233
234
235
236
237
238
239
240
241
242
243
244
245
246
247
248
249
250
251
252
253
254
255
256
257
258
259
260
261
262
263
264
265
266
267
268
269
270
271
272
273
274
275
276
277
278
279
280
281
282
283
284
285
286
287
288
289
290
291
292
293
294
295
296
297
298
299
300
301
302
303
304
305
306
307
308
309
310
311
312
313
314
315
316
317
318
319
320
321
322
323
324
325
326
327
328
329
330
331
332
333
334
335
336
337
338
339
340
341
342
343
344
345
346
347
apiVersion: v1
kind: ConfigMap
metadata:
  name: argocd-metrics-server-configmap
data:
  config.json: |
    {
      "prometheus": {
        "applications": [
          {
            "name": "default",
            "default": true,
            "dashboards": [
              {
                "groupKind": "pod",
                "tabs": ["Golden Signal", "Resource Usage", "Network", "Storage"],
                "rows": [
                  {
                    "name": "pod_cpu",
                    "title": "CPU Usage",
                    "tab": "Golden Signal",
                    "graphs": [
                      {
                        "name": "pod_cpu_line",
                        "title": "CPU Usage",
                        "description": "CPU usage by pod over time",
                        "graphType": "line",
                        "metricName": "pod",
                        "queryExpression": "sum(rate(container_cpu_usage_seconds_total{pod=~\"{{.name}}\", image!=\"\", container!=\"POD\", container!=\"\"}[5m])) by (pod)"
                      },
                      {
                        "name": "pod_cpu_pie",
                        "title": "CPU Distribution",
                        "description": "Average CPU distribution",
                        "graphType": "pie",
                        "metricName": "pod",
                        "queryExpression": "avg(rate(container_cpu_usage_seconds_total{pod=~\"{{.name}}\", container!=\"POD\", image!=\"\", container!=\"\"}[5m])) by (pod)"
                      }
                    ]
                  },
                  {
                    "name": "pod_memory",
                    "title": "Memory Usage",
                    "tab": "Golden Signal",
                    "graphs": [
                      {
                        "name": "pod_memory_line",
                        "title": "Memory Usage",
                        "description": "Memory usage by pod over time",
                        "graphType": "line",
                        "metricName": "pod",
                        "queryExpression": "sum(container_memory_usage_bytes{pod=~\"{{.name}}\", container!=\"POD\", image!=\"\", container!=\"\"}) by (pod)"
                      },
                      {
                        "name": "pod_memory_pie",
                        "title": "Memory Distribution",
                        "description": "Average memory distribution",
                        "graphType": "pie",
                        "metricName": "pod",
                        "queryExpression": "avg(container_memory_usage_bytes{pod=~\"{{.name}}\", container!=\"POD\", image!=\"\", container!=\"\"}) by (pod)"
                      }
                    ]
                  },
                  {
                    "name": "cpu_throttling",
                    "title": "CPU Throttling",
                    "tab": "Resource Usage",
                    "graphs": [
                      {
                        "name": "cpu_throttle_line",
                        "title": "CPU Throttling",
                        "description": "CPU throttling periods",
                        "graphType": "line",
                        "metricName": "pod",
                        "queryExpression": "sum(rate(container_cpu_cfs_throttled_periods_total{pod=~\"{{.name}}\", container!=\"POD\", container!=\"\"}[5m])) by (pod)"
                      }
                    ]
                  },
                  {
                    "name": "memory_working_set",
                    "title": "Memory Working Set",
                    "tab": "Resource Usage",
                    "graphs": [
                      {
                        "name": "memory_working_set_line",
                        "title": "Memory Working Set",
                        "description": "Active memory in use",
                        "graphType": "line",
                        "metricName": "pod",
                        "queryExpression": "sum(container_memory_working_set_bytes{pod=~\"{{.name}}\", container!=\"POD\", container!=\"\"}) by (pod)"
                      }
                    ]
                  },
                  {
                    "name": "memory_cache",
                    "title": "Memory Cache",
                    "tab": "Resource Usage",
                    "graphs": [
                      {
                        "name": "memory_cache_line",
                        "title": "Memory Cache",
                        "description": "Cached memory",
                        "graphType": "line",
                        "metricName": "pod",
                        "queryExpression": "sum(container_memory_cache{pod=~\"{{.name}}\", container!=\"POD\", container!=\"\"}) by (pod)"
                      }
                    ]
                  },
                  {
                    "name": "network_receive",
                    "title": "Network Receive",
                    "tab": "Network",
                    "graphs": [
                      {
                        "name": "network_receive_bytes",
                        "title": "Network Receive Bytes/sec",
                        "description": "Network bytes received per second",
                        "graphType": "line",
                        "metricName": "pod",
                        "queryExpression": "sum(rate(container_network_receive_bytes_total{pod=~\"{{.name}}\"}[5m])) by (pod)"
                      },
                      {
                        "name": "network_receive_packets",
                        "title": "Network Receive Packets/sec",
                        "description": "Network packets received per second",
                        "graphType": "line",
                        "metricName": "pod",
                        "queryExpression": "sum(rate(container_network_receive_packets_total{pod=~\"{{.name}}\"}[5m])) by (pod)"
                      }
                    ]
                  },
                  {
                    "name": "network_transmit",
                    "title": "Network Transmit",
                    "tab": "Network",
                    "graphs": [
                      {
                        "name": "network_transmit_bytes",
                        "title": "Network Transmit Bytes/sec",
                        "description": "Network bytes transmitted per second",
                        "graphType": "line",
                        "metricName": "pod",
                        "queryExpression": "sum(rate(container_network_transmit_bytes_total{pod=~\"{{.name}}\"}[5m])) by (pod)"
                      },
                      {
                        "name": "network_transmit_packets",
                        "title": "Network Transmit Packets/sec",
                        "description": "Network packets transmitted per second",
                        "graphType": "line",
                        "metricName": "pod",
                        "queryExpression": "sum(rate(container_network_transmit_packets_total{pod=~\"{{.name}}\"}[5m])) by (pod)"
                      }
                    ]
                  },
                  {
                    "name": "network_errors",
                    "title": "Network Errors",
                    "tab": "Network",
                    "graphs": [
                      {
                        "name": "network_receive_errors",
                        "title": "Network Receive Errors",
                        "description": "Network receive errors",
                        "graphType": "line",
                        "metricName": "pod",
                        "queryExpression": "sum(rate(container_network_receive_errors_total{pod=~\"{{.name}}\"}[5m])) by (pod)"
                      },
                      {
                        "name": "network_transmit_errors",
                        "title": "Network Transmit Errors",
                        "description": "Network transmit errors",
                        "graphType": "line",
                        "metricName": "pod",
                        "queryExpression": "sum(rate(container_network_transmit_errors_total{pod=~\"{{.name}}\"}[5m])) by (pod)"
                      }
                    ]
                  },
                  {
                    "name": "fs_reads",
                    "title": "Filesystem Reads",
                    "tab": "Storage",
                    "graphs": [
                      {
                        "name": "fs_read_bytes",
                        "title": "Filesystem Read Bytes/sec",
                        "description": "Filesystem bytes read per second",
                        "graphType": "line",
                        "metricName": "pod",
                        "queryExpression": "sum(rate(container_fs_reads_bytes_total{pod=~\"{{.name}}\", container!=\"POD\", container!=\"\"}[5m])) by (pod)"
                      },
                      {
                        "name": "fs_reads_total",
                        "title": "Filesystem Reads/sec",
                        "description": "Filesystem read operations per second",
                        "graphType": "line",
                        "metricName": "pod",
                        "queryExpression": "sum(rate(container_fs_reads_total{pod=~\"{{.name}}\", container!=\"POD\", container!=\"\"}[5m])) by (pod)"
                      }
                    ]
                  },
                  {
                    "name": "fs_writes",
                    "title": "Filesystem Writes",
                    "tab": "Storage",
                    "graphs": [
                      {
                        "name": "fs_write_bytes",
                        "title": "Filesystem Write Bytes/sec",
                        "description": "Filesystem bytes written per second",
                        "graphType": "line",
                        "metricName": "pod",
                        "queryExpression": "sum(rate(container_fs_writes_bytes_total{pod=~\"{{.name}}\", container!=\"POD\", container!=\"\"}[5m])) by (pod)"
                      },
                      {
                        "name": "fs_writes_total",
                        "title": "Filesystem Writes/sec",
                        "description": "Filesystem write operations per second",
                        "graphType": "line",
                        "metricName": "pod",
                        "queryExpression": "sum(rate(container_fs_writes_total{pod=~\"{{.name}}\", container!=\"POD\", container!=\"\"}[5m])) by (pod)"
                      }
                    ]
                  },
                  {
                    "name": "fs_usage",
                    "title": "Filesystem Usage",
                    "tab": "Storage",
                    "graphs": [
                      {
                        "name": "fs_usage_bytes",
                        "title": "Filesystem Usage",
                        "description": "Filesystem space used",
                        "graphType": "line",
                        "metricName": "pod",
                        "queryExpression": "sum(container_fs_usage_bytes{pod=~\"{{.name}}\", container!=\"POD\", container!=\"\"}) by (pod)"
                      },
                      {
                        "name": "fs_limit_bytes",
                        "title": "Filesystem Limit",
                        "description": "Filesystem capacity",
                        "graphType": "line",
                        "metricName": "pod",
                        "queryExpression": "sum(container_fs_limit_bytes{pod=~\"{{.name}}\", container!=\"POD\", container!=\"\"}) by (pod)"
                      }
                    ]
                  }
                ]
              },
              {
                "groupKind": "deployment",
                "tabs": ["Application Metrics", "Resource Usage"],
                "rows": [
                  {
                    "name": "http_latency",
                    "title": "HTTP Latency",
                    "tab": "Application Metrics",
                    "graphs": [
                      {
                        "name": "http_200_latency",
                        "title": "HTTP 200 Latency",
                        "description": "HTTP request latency for successful requests",
                        "graphType": "line",
                        "metricName": "pod_template_hash",
                        "queryExpression": "sum(rate(http_server_requests_seconds_sum{namespace=\"{{.namespace}}\", status=\"200\"}[1m])) by (pod_template_hash)"
                      }
                    ]
                  },
                  {
                    "name": "http_error_rate",
                    "title": "HTTP Error Rate",
                    "tab": "Application Metrics",
                    "graphs": [
                      {
                        "name": "http_error_rate_500",
                        "title": "HTTP 5xx Errors",
                        "description": "HTTP 5xx server errors",
                        "graphType": "line",
                        "metricName": "pod_template_hash",
                        "queryExpression": "sum(rate(http_server_requests_seconds_count{namespace=\"{{.namespace}}\", status=~\"5..\"}[1m])) by (pod_template_hash)"
                      },
                      {
                        "name": "http_error_rate_400",
                        "title": "HTTP 4xx Errors",
                        "description": "HTTP 4xx client errors",
                        "graphType": "line",
                        "metricName": "pod_template_hash",
                        "queryExpression": "sum(rate(http_server_requests_seconds_count{namespace=\"{{.namespace}}\", status=~\"4..\"}[1m])) by (pod_template_hash)"
                      }
                    ]
                  },
                  {
                    "name": "http_traffic",
                    "title": "HTTP Traffic",
                    "tab": "Application Metrics",
                    "graphs": [
                      {
                        "name": "http_traffic",
                        "title": "Request Rate",
                        "description": "HTTP requests per second",
                        "graphType": "line",
                        "metricName": "pod_template_hash",
                        "queryExpression": "sum(rate(http_server_requests_seconds_count{namespace=\"{{.namespace}}\"}[1m])) by (pod_template_hash)"
                      }
                    ]
                  },
                  {
                    "name": "deployment_cpu",
                    "title": "CPU Usage",
                    "tab": "Resource Usage",
                    "graphs": [
                      {
                        "name": "deployment_cpu_line",
                        "title": "CPU Usage",
                        "description": "CPU usage by deployment",
                        "graphType": "line",
                        "metricName": "pod",
                        "queryExpression": "sum(rate(container_cpu_usage_seconds_total{namespace=\"{{.namespace}}\", pod=~\"{{.name}}.*\", image!=\"\", container!=\"POD\"}[5m])) by (pod)"
                      }
                    ]
                  },
                  {
                    "name": "deployment_memory",
                    "title": "Memory Usage",
                    "tab": "Resource Usage",
                    "graphs": [
                      {
                        "name": "deployment_memory_line",
                        "title": "Memory Usage",
                        "description": "Memory usage by deployment",
                        "graphType": "line",
                        "metricName": "pod",
                        "queryExpression": "sum(container_memory_usage_bytes{namespace=\"{{.namespace}}\", pod=~\"{{.name}}.*\", container!=\"POD\", container!=\"\"}) by (pod)"
                      }
                    ]
                  }
                ]
              }
            ]
          }
        ],
        "provider": {
          "name": "default",
          "default": true,
          "address": "http://kube-prometheus-stack-prometheus.monitoring.svc:9090"
        }
      }
    }
CHECK

Vous pouvez suivre le déploiement de argocd-extension-metrics de deux manières:

Vérifier le pod du serveur de métriques.
kubectl get pods -n argocd -l app=argocd-metrics-server
NAME                                     READY   STATUS    RESTARTS   AGE
argocd-metrics-server-7bb9646784-cbvbg   1/1     Running   0          18h

Vérifier les logs.
kubectl logs -n argocd -l app=argocd-metrics-server
pod deployment
deployment deployment
[GIN] 2025/12/10 - 19:34:27 | 200 |     638.948µs |       127.0.0.1 | GET      "/api/applications/argocd-metrics-server/groupkinds/deployment/rows/http_traffic/graphs/http_traffic?name=argocd-metrics-server.*&namespace=argocd&application_name=argocd-metrics-server&project=default&uid=28274042-5c9c-4a79-a390-8527e3ae67cb&duration=1h"
[GIN] 2025/12/10 - 19:34:27 | 200 |     708.646µs |       127.0.0.1 | GET      "/api/applications/argocd-metrics-server/groupkinds/deployment/rows/http_error_rate/graphs/http_error_rate_400?name=argocd-metrics-server.*&namespace=argocd&application_name=argocd-metrics-server&project=default&uid=28274042-5c9c-4a79-a390-8527e3ae67cb&duration=1h"
pod deployment
deployment deployment
pod deployment
deployment deployment
[GIN] 2025/12/10 - 19:34:31 | 200 |    1.073685ms |       127.0.0.1 | GET      "/api/applications/argocd-metrics-server/groupkinds/deployment/rows/deployment_memory/graphs/deployment_memory_line?name=argocd-metrics-server.*&namespace=argocd&application_name=argocd-metrics-server&project=default&uid=28274042-5c9c-4a79-a390-8527e3ae67cb&duration=1h"
[GIN] 2025/12/10 - 19:34:31 | 200 |    1.045537ms |       127.0.0.1 | GET      "/api/applications/argocd-metrics-server/groupkinds/deployment/rows/deployment_cpu/graphs/deployment_cpu_line?name=argocd-metrics-server.*&namespace=argocd&application_name=argocd-metrics-server&project=default&uid=28274042-5c9c-4a79-a390-8527e3ae67cb&duration=1h"
Appuyez sur Ctrl+C pour arrêter l'observation une fois que tous les pods sont en cours d'exécution.

  1. Actualisez l'interface utilisateur d'Argo CD https://localhost:8080
  2. Vous verrez l'application argocd-metrics-server
  3. Cliquez dessus pour voir la progression du déploiement
  4. Attendez que l'état soit "Healthy" et "Synced"

Ajouter des métriques personnalisées

Les métriques affichées sont configurées dans la ConfigMap argocd-metrics-server-configmap ci-dessus.

Query Variables disponibles

Dans vos requêtes Prometheus, vous pouvez utiliser ces variables de modèle :

  • {{.metadata.name}} - Nom de la ressource
  • {{.metadata.namespace}} - Namespace de la ressource
  • {{.metadata.labels.KEY}} - Valeur de n'importe quelle étiquette

WARNING

Après modification, redémarrez le serveur de métriques sauf si vous utiliez Reloader

kubectl rollout restart deployment argocd-metrics-server -n argocd

Ajouter des métriques pour d'autres ressources

Vous pouvez ajouter des métriques pour n'importe quel type de ressource Kubernetes.
Par exemple, pour ajouter des métriques pour les StatefulSets:

extension.metrics.statefulsets: |
  - name: "CPU Usage"
    description: "CPU usage for the statefulset"
    type: "graph"
    graphType: "area"
    yAxisLabel: "CPU Cores"
    query: 'sum(rate(container_cpu_usage_seconds_total{namespace="{{.metadata.namespace}}", pod=~"{{.metadata.name}}-.*"}[5m])) by (pod)'

PodInfo

Déployons maintenant Podinfo via Argo CD.

Créer le manifeste Application Podinfo

apps/podinfo.yaml
 1
 2
 3
 4
 5
 6
 7
 8
 9
10
11
12
13
14
15
16
17
18
19
20
21
22
apiVersion: argoproj.io/v1alpha1
kind: Application
metadata:
  name: podinfo
  namespace: argocd
  finalizers:
    - resources-finalizer.argocd.argoproj.io
spec:
  project: default
  source:
    repoURL: https://github.com/stefanprodan/podinfo.git
    targetRevision: HEAD
    path: kustomize
  destination:
    server: https://kubernetes.default.svc
    namespace: podinfo
  syncPolicy:
    automated:
      prune: true
      selfHeal: true
    syncOptions:
      - CreateNamespace=true
CHECK

Vous pouvez suivre le déploiement de PodInfo de deux manières:

Observer la synchronisation de l'application
kubectl get application podinfo -n argocd -w
NAME                    SYNC STATUS   HEALTH STATUS
podinfo                 Synced        Healthy

Observer la création des pods dans le namespace podinfo
kubectl get pods -n podinfo -w
NAME                       READY   STATUS    RESTARTS   AGE
podinfo-86f68db776-68gc4   1/1     Running   0          14h
podinfo-86f68db776-vwzjk   1/1     Running   0          14h
Appuyez sur Ctrl+C pour arrêter l'observation une fois que tous les pods sont en cours d'exécution.

  1. Actualisez l'interface utilisateur d'Argo CD https://localhost:8080
  2. Vous verrez l'application podinfo
  3. Cliquez dessus pour voir la progression du déploiement
  4. Attendez que l'état soit "Healthy" et "Synced"

Note

Accéder à l'interface de PodInfo

kubectl port-forward -n podinfo svc/podinfo 9898:9898

Ouvrez http://localhost:9898 pour voir:

  • Informations sur la version
  • Détails sur l'exécution
  • Points de terminaison de santé
  • Point de terminaison des métriques à /metrics

Déployer App-of-Apps

kubectl apply -f apps/app-of-apps.yaml

C'est tout ! 🎉 Argo CD déploiera automatiquement:

  • Prometheus
  • Serveur de métriques
  • Podinfo
CHECK
Lister toutes les applications
kubectl get applications -n argocd
NAME                    SYNC STATUS   HEALTH STATUS
argocd-metrics-server   Synced        Healthy
kube-prometheus-stack   Synced        Healthy
podinfo                 Synced        Healthy
root-app                Synced        Healthy

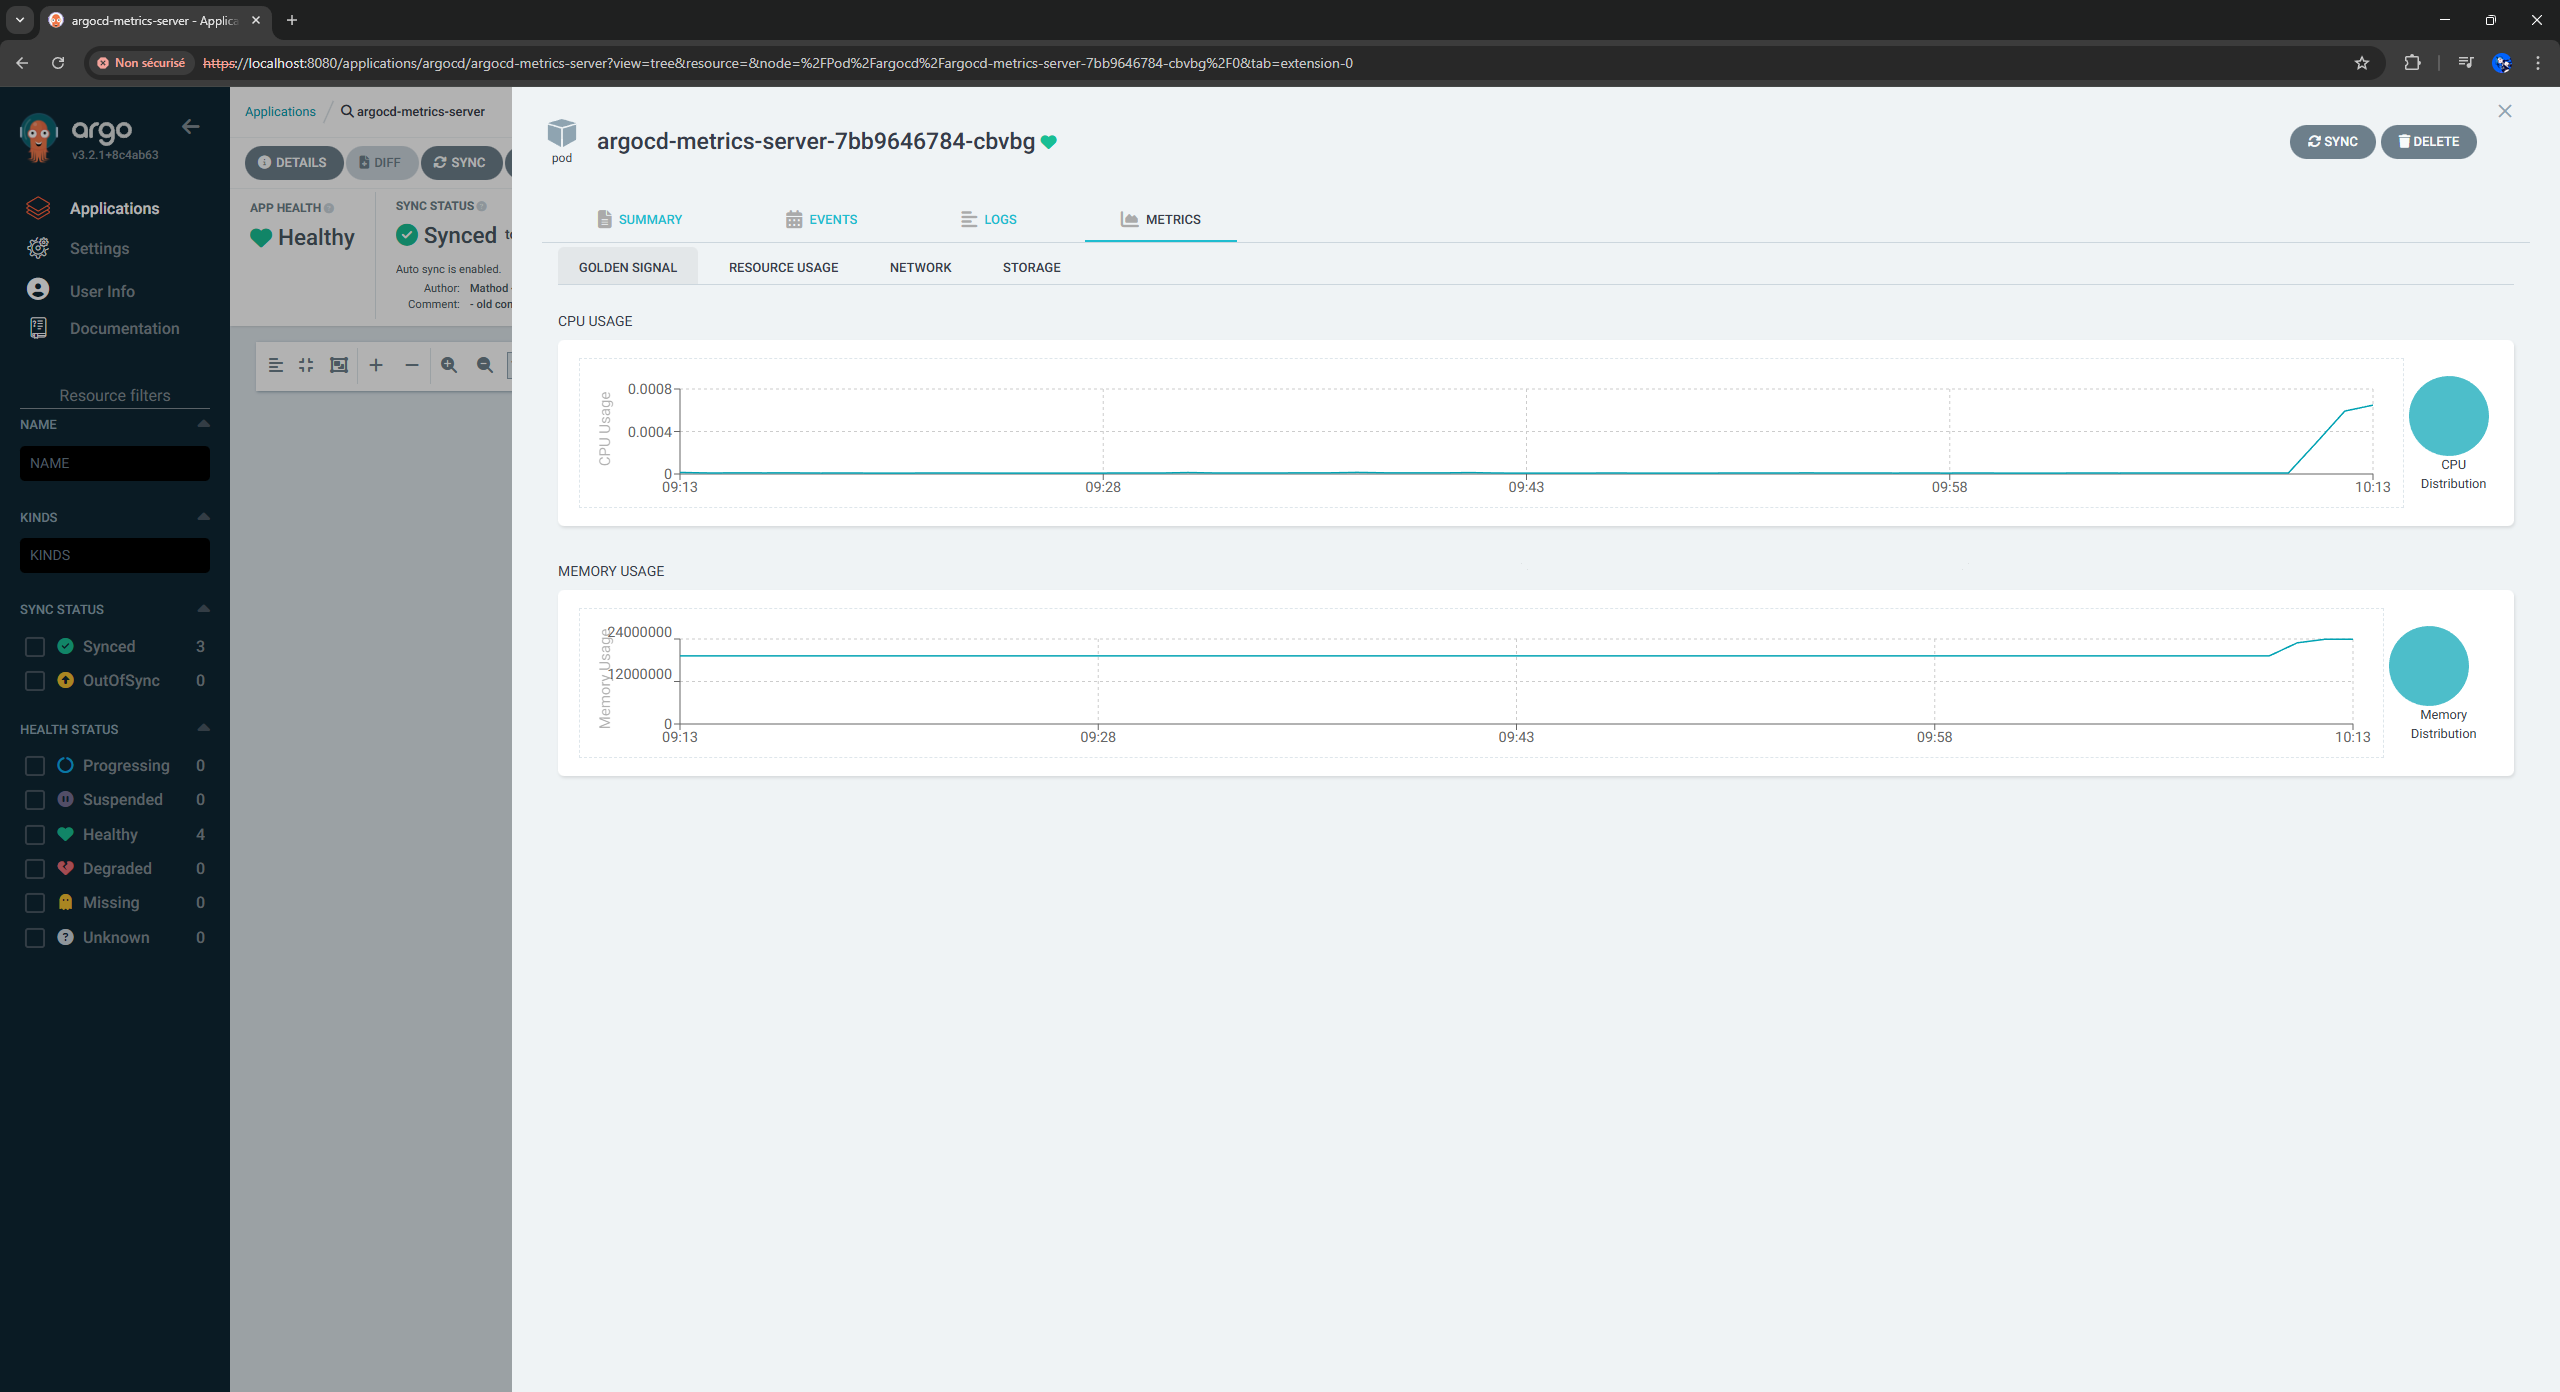
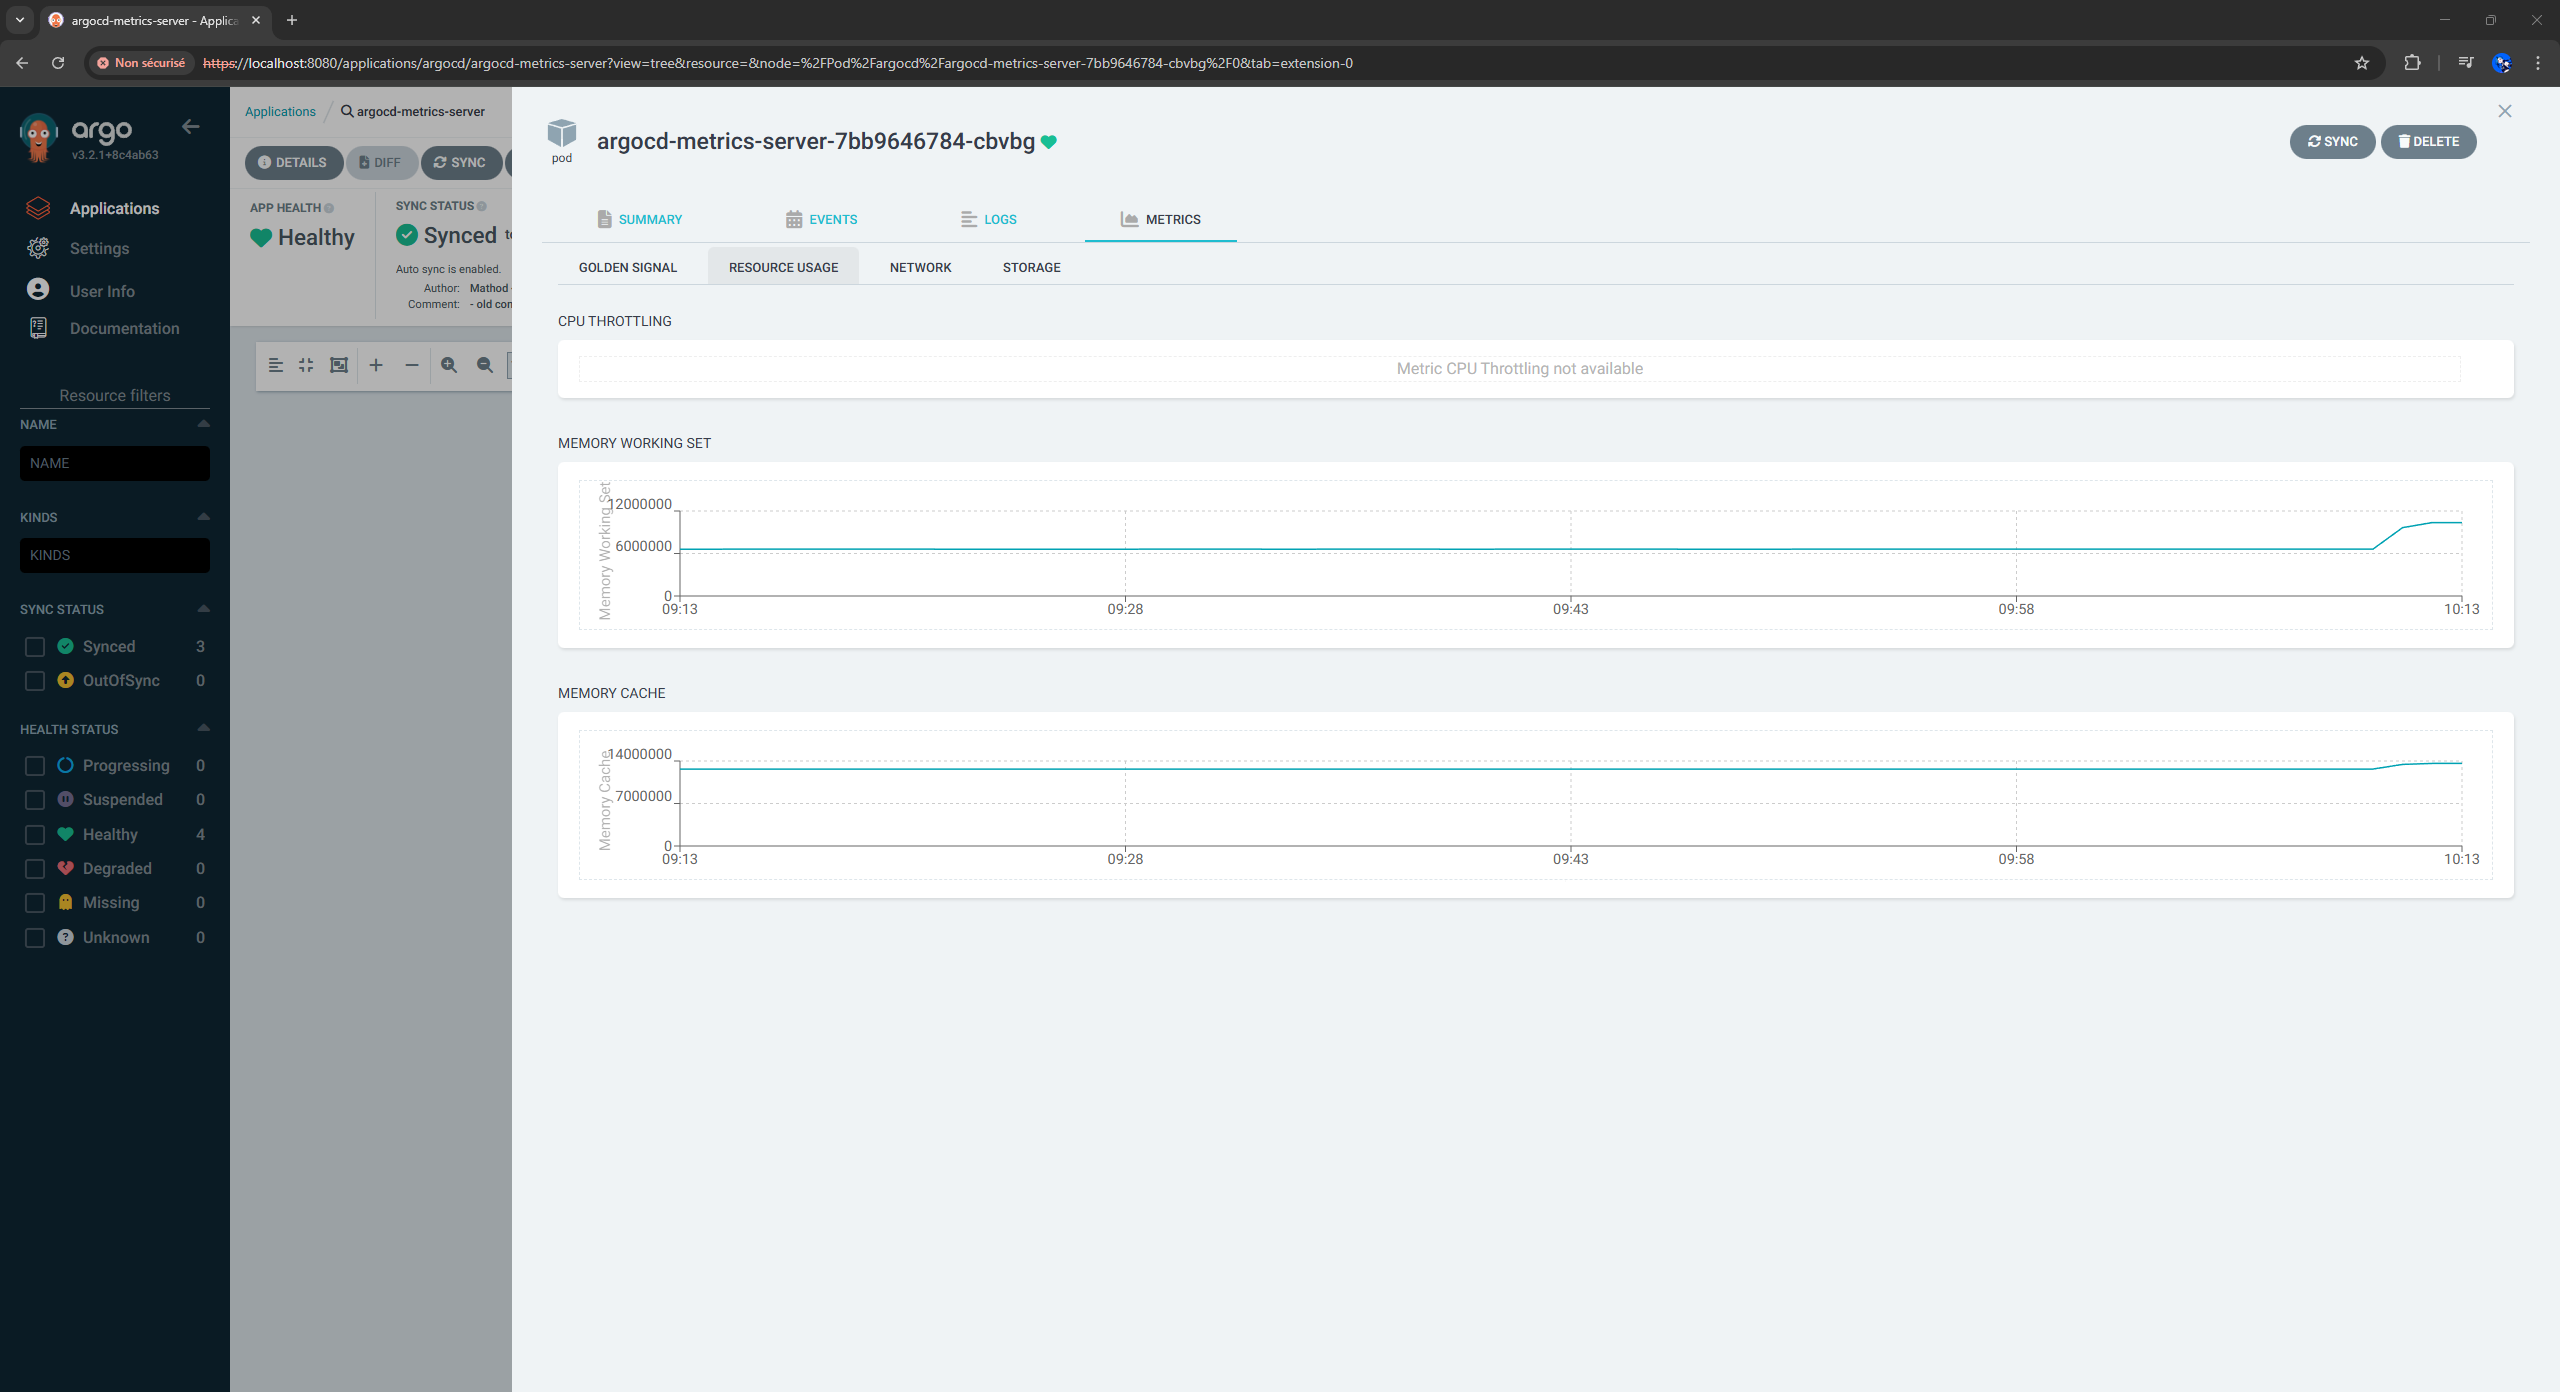
Voir les métriques dans l'interface Argo CD

  1. Dans l'interface Argo CD, cliquez sur l'application podinfo
  2. Cliquez sur le déploiement
  3. Cherchez l'onglet "Metrics"
  4. Cliquez dessus pour voir :
    • Graphiques de l’utilisation CPU
    • Graphiques de l’utilisation de la mémoire
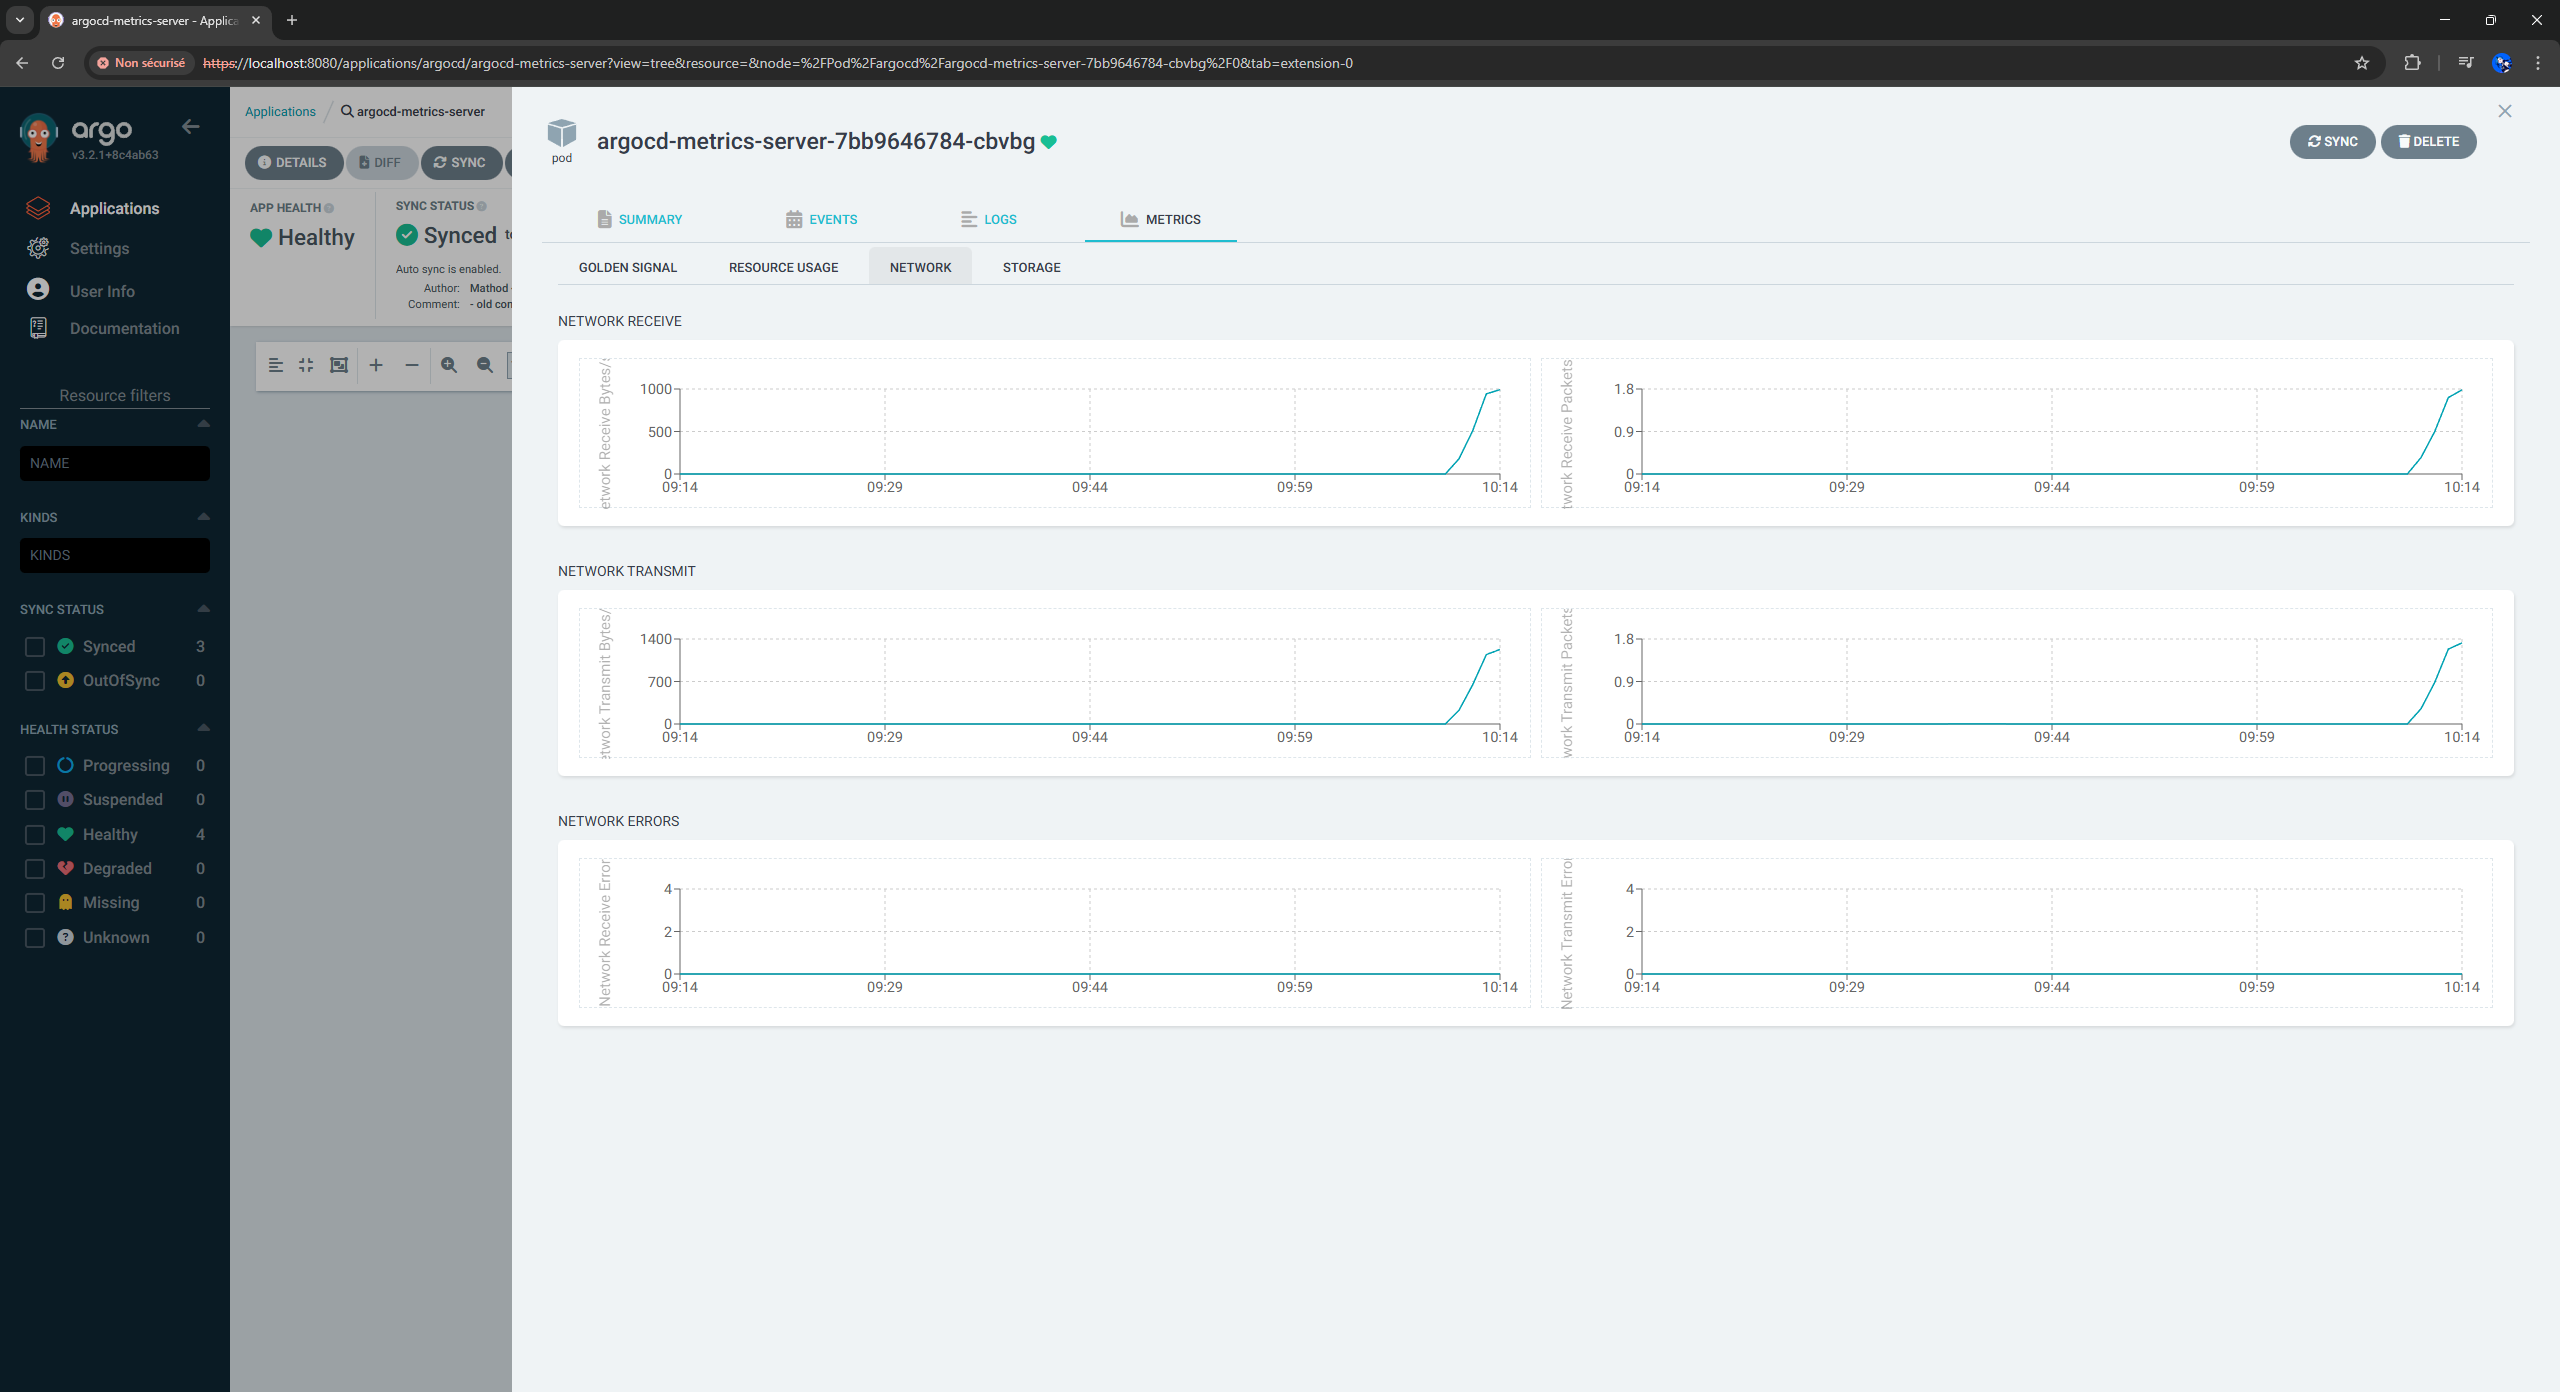
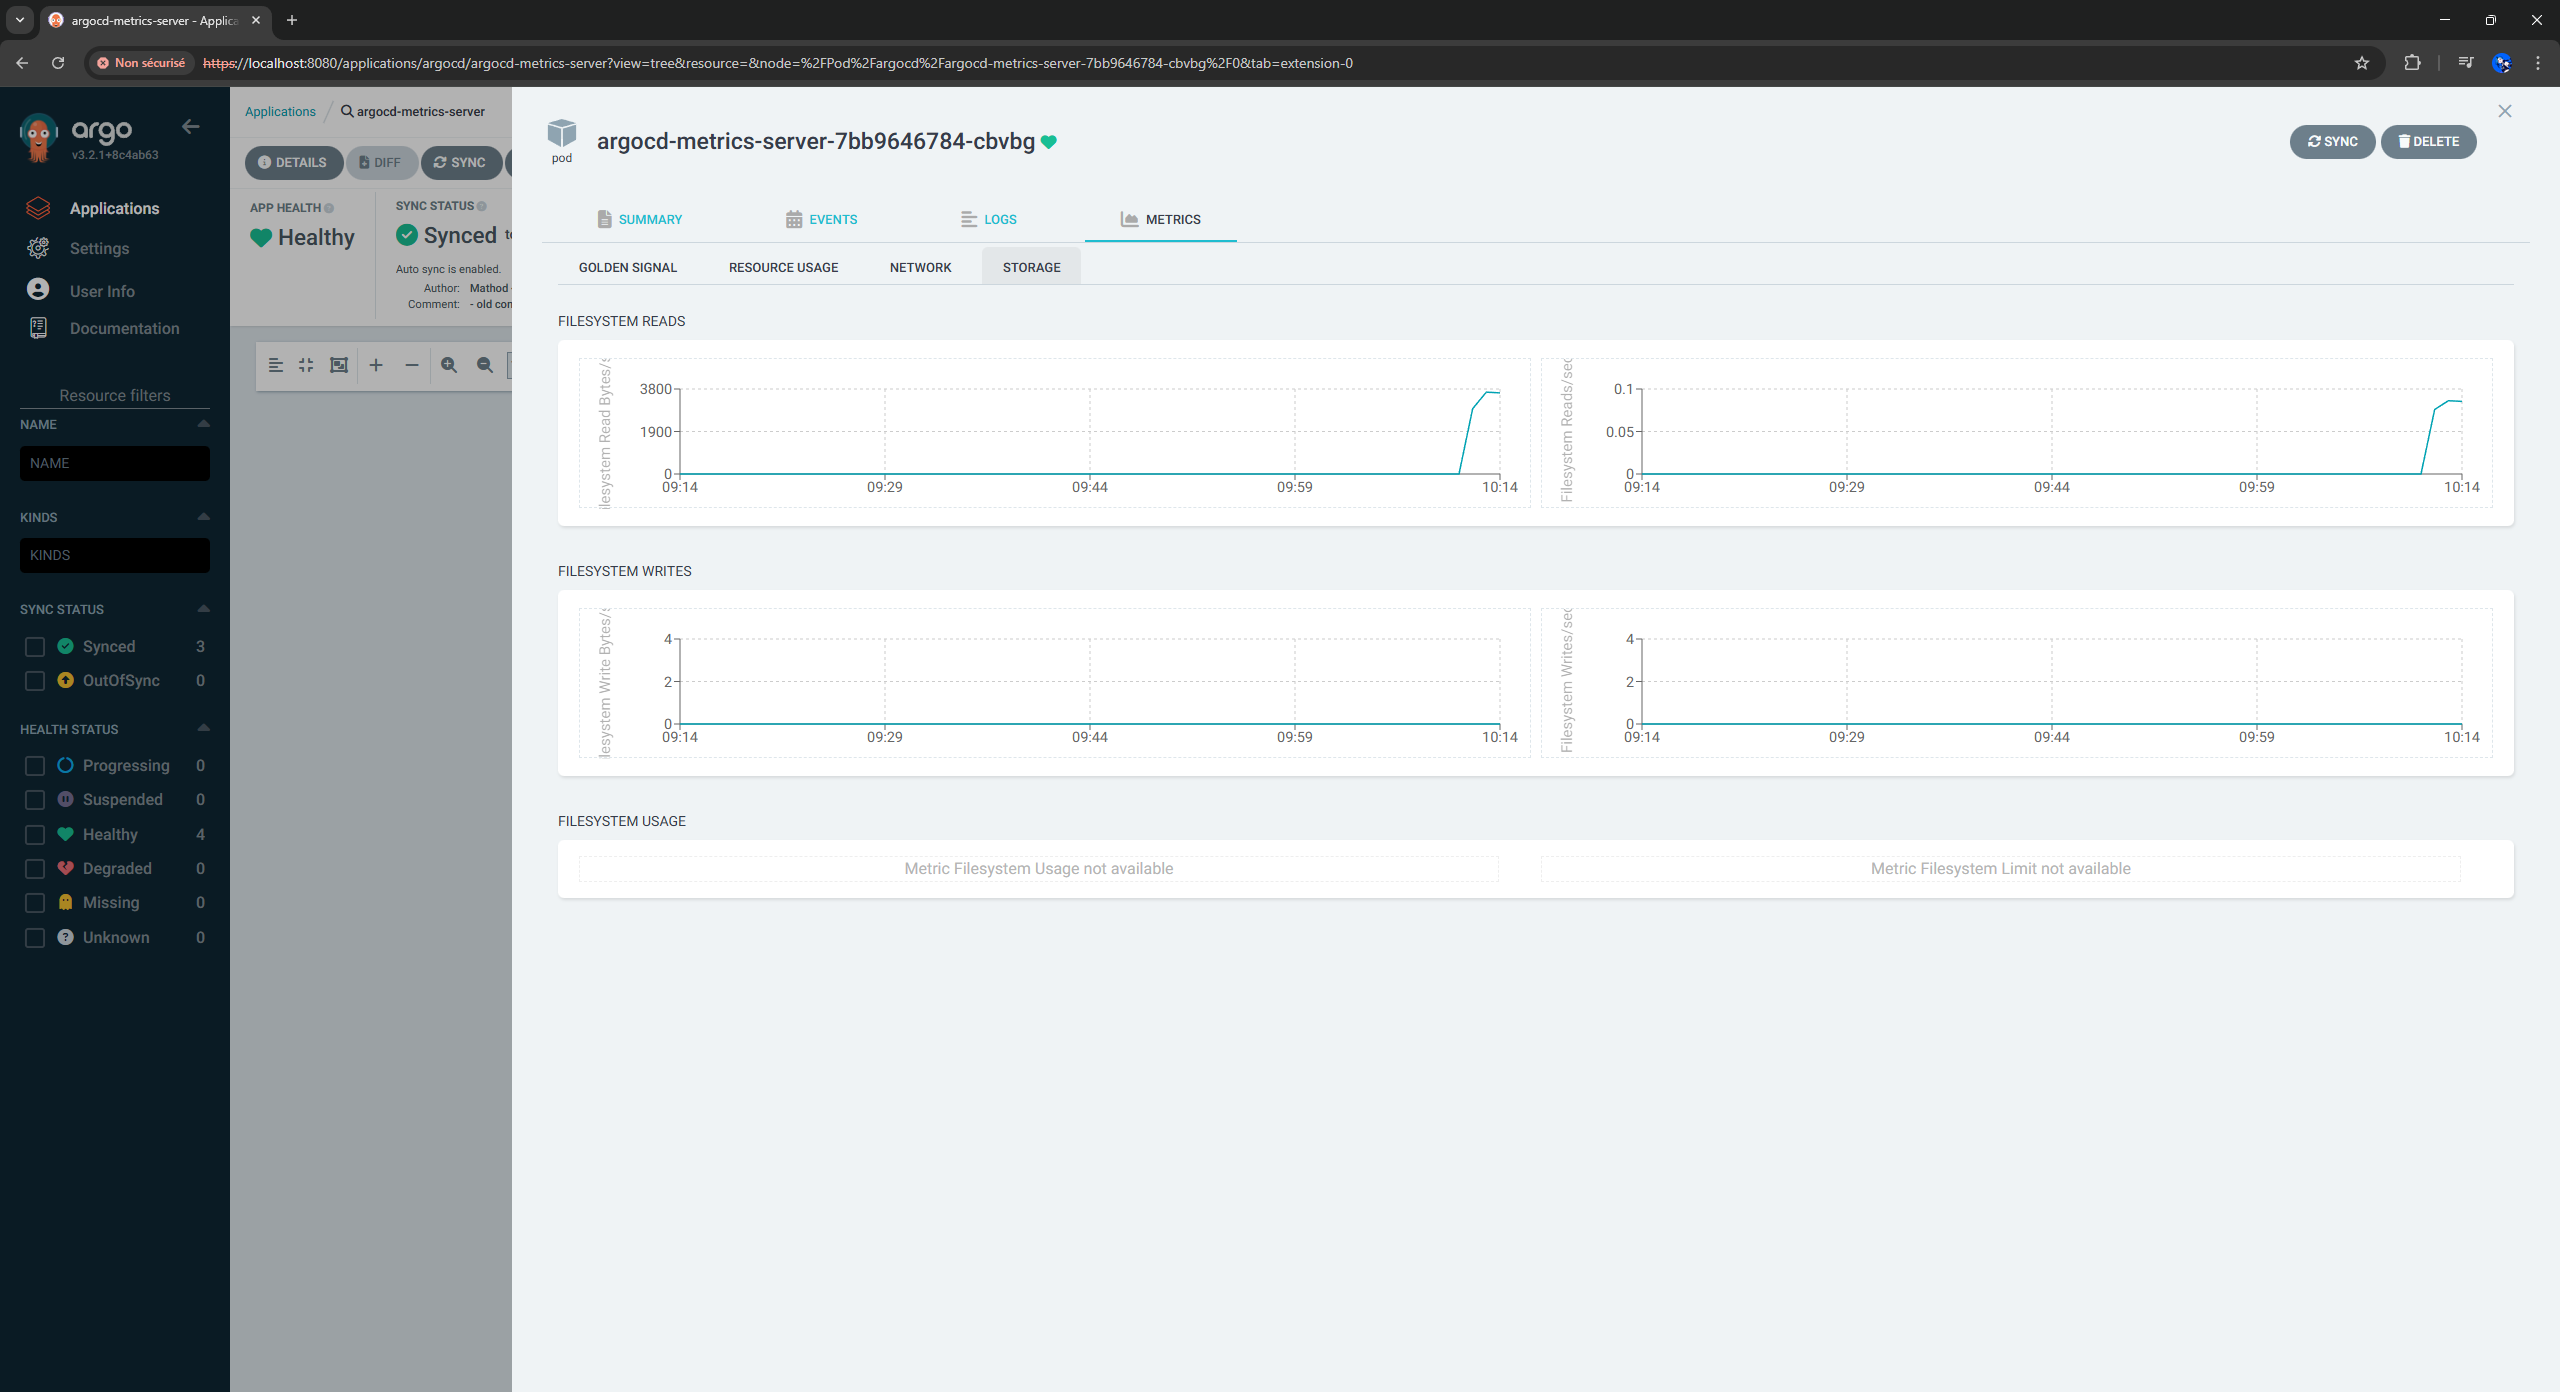
    • Graphiques du réseau (I/O)

Voir les métriques au niveau du pod

  1. Depuis la vue de l'application podinfo, cliquez sur n'importe quel Pod
  2. Allez dans l'onglet Metrics
  3. Vous verrez les métriques individuelles du pod

🎉 Bravo ! Vous voyez maintenant les métriques Prometheus directement dans Argo CD !

Générer du trafic vers Podinfo

Générons un peu de trafic pour voir les métriques dynamiques:

Port forwarding vers podinfo
kubectl port-forward -n podinfo svc/podinfo 9898:9898 &
Générer du trafic
for i in {1..100}; do
  curl -s http://localhost:9898 > /dev/null
  echo "Requête $i terminée"
  sleep 0.1
done

Nettoyage

Suppression des ressources
Supprimer l'application root-app (cela supprimera toutes les applications enfants)
kubectl delete application root-app -n argocd
Supprimer Argo CD
helm uninstall argocd -n argocd
Supprimer le cluster Kind
kind delete cluster --name argocd-demo

Commandes utiles

TIPS
Obtenir le mot de passe admin
kubectl -n argocd get secret argocd-initial-admin-secret -o jsonpath="{.data.password}" | base64 -d
Faire du port forwarding vers l'UI
kubectl port-forward svc/argocd-server -n argocd 8080:443
Lister les applications
kubectl get applications -n argocd
Vérifiez si l'extension est chargée
kubectl logs -n argocd deployment/argocd-server | grep extension
Obtenir les détails d'une application
kubectl get application podinfo -n argocd -o yaml
Vérifiez que le serveur de métriques fonctionne
kubectl get pods -n argocd | grep metrics-server
Forcer la synchronisation
kubectl patch application podinfo -n argocd --type merge -p '{"operation":{"initiatedBy":{"username":"admin"},"sync":{"revision":"HEAD"}}}'
Voir le statut de la synchronisation
kubectl get applications -n argocd -o jsonpath='{range .items[*]}{.metadata.name}{"\t"}{.status.health.status}{"\t"}{.status.sync.status}{"\n"}{end}'
Surveiller tous les pods dans tous les namespaces
kubectl get pods -A -w
Vérifier l'état de synchronisation de l'application
kubectl get applications -n argocd -w
Voir les logs du serveur Argo CD
kubectl logs -n argocd deployment/argocd-server -f
Voir les logs du argocd-metrics
kubectl logs -n argocd deployment/argocd-metrics-server -f
Voir les détails de l'application
kubectl describe application <app-name> -n argocd
Root app logs
kubectl logs -n argocd deployment/argocd-application-controller -f
Metrics server logs
kubectl logs -n argocd -l app=argocd-metrics-server -f
Kill existing port forwards
pkill -f "port-forward"

En résumé

Vous avez maintenant:

  • Single Source of Truth: Tout dans votre dépôt Git
  • Configuration declarative: Toute la configuration est déclarée dans des fichiers YAML.
  • Rollback: Facile à annuler via Git.
  • Pas de dépendances externes: Ne sera pas affecté si les dépôts externes changent.
  • App of Apps pattern: Structure plusieurs applications sous une racine, simplifiant leur gestion et déploiement.
  • Sources officielles: Utilisation des manifests, images et charts officiels
  • Intégration des métriques: Métriques Prometheus dans l'interface Argo CD
  • Prêt pour la production: Structure adaptée pour les déploiements réels
  • Self-Healing: Argo CD et configurer pour auto-syncs et heals les applications
  • Contrôle de version et traçabilité complète: Toutes les modifications sont suivies, avec une trace d'audit complète.
  • Déploiement en une commande: kubectl apply -f apps/app-of-apps.yaml par la suite Argo CD surveille votre dépôt pour détecter les changements.

Conclusion

Prochaines étapes

  1. Personnalisez les configurations selon vos besoins
  2. Ajoutez d'autres applications
  3. Configurez le CI/CD pour mettre à jour votre dépôt
  4. Ajoutez la surveillance et les alertes
  5. Implémentez la gestion multi-environnements
  6. Ajoutez vos requêtes Prometheus personnalisées
  7. Ajouter de nouvelles applications

Documentation

Documentation

url: https://github.com/argoproj-labs/argocd-extension-metrics
url: https://prometheus.io/docs/introduction/overview/
image: https://raw.githubusercontent.com/cncf/artwork/9e203aa38643bbf0fcb081dbaa80abbd0f6f0698/projects/prometheus/icon/color/prometheus-icon-color.svg
url: https://argo-cd.readthedocs.io/en/stable/
image: https://raw.githubusercontent.com/cncf/artwork/9e203aa38643bbf0fcb081dbaa80abbd0f6f0698/projects/argo/icon/color/argo-icon-color.svg